AI SCADA
Complex, web-based data control.
DataTalk AI SCADA sets new benchmarks for SCADA systems with its web-based platform and integrated real-time Project Designer. It offers features like AI-driven analytics, 2D/3D views, interactive dashboards, advanced charts, live camera feeds, and a no-code graphical compute module. Built on modern web standards, it includes a high-performance time-series database, integrated redundancy, containerized architecture, and quick 5-second updates.
Compatible with Linux and Windows, this AI SCADA solution is designed to transform process visualization and management for companies.
DataTalk AI SCADA
Six Strong Reasons to Choose Our AI-Powered SCADA
Datatalk AI SCADA
Reasons to Choose Us
See the functionality in detail:
01
AI module
Enhancing system intelligence with advanced data analysis
LLM-Powered Insights: Utilizes Large Language Model (LLM) technology for deep data analysis and intelligent decision-making.
Contextual Understanding: Analyzes uploaded manuals and documents to gain domain-specific knowledge, improving the accuracy of live data interpretation.
Real-Time Monitoring: Continuously tracks data from PLCs, alarms and critical data tags, detecting significant events as they happen.
Historical Data Analysis: Identifies patterns, trends and recurring issues by examining historical data, enabling predictive insights and anomaly detection.
02
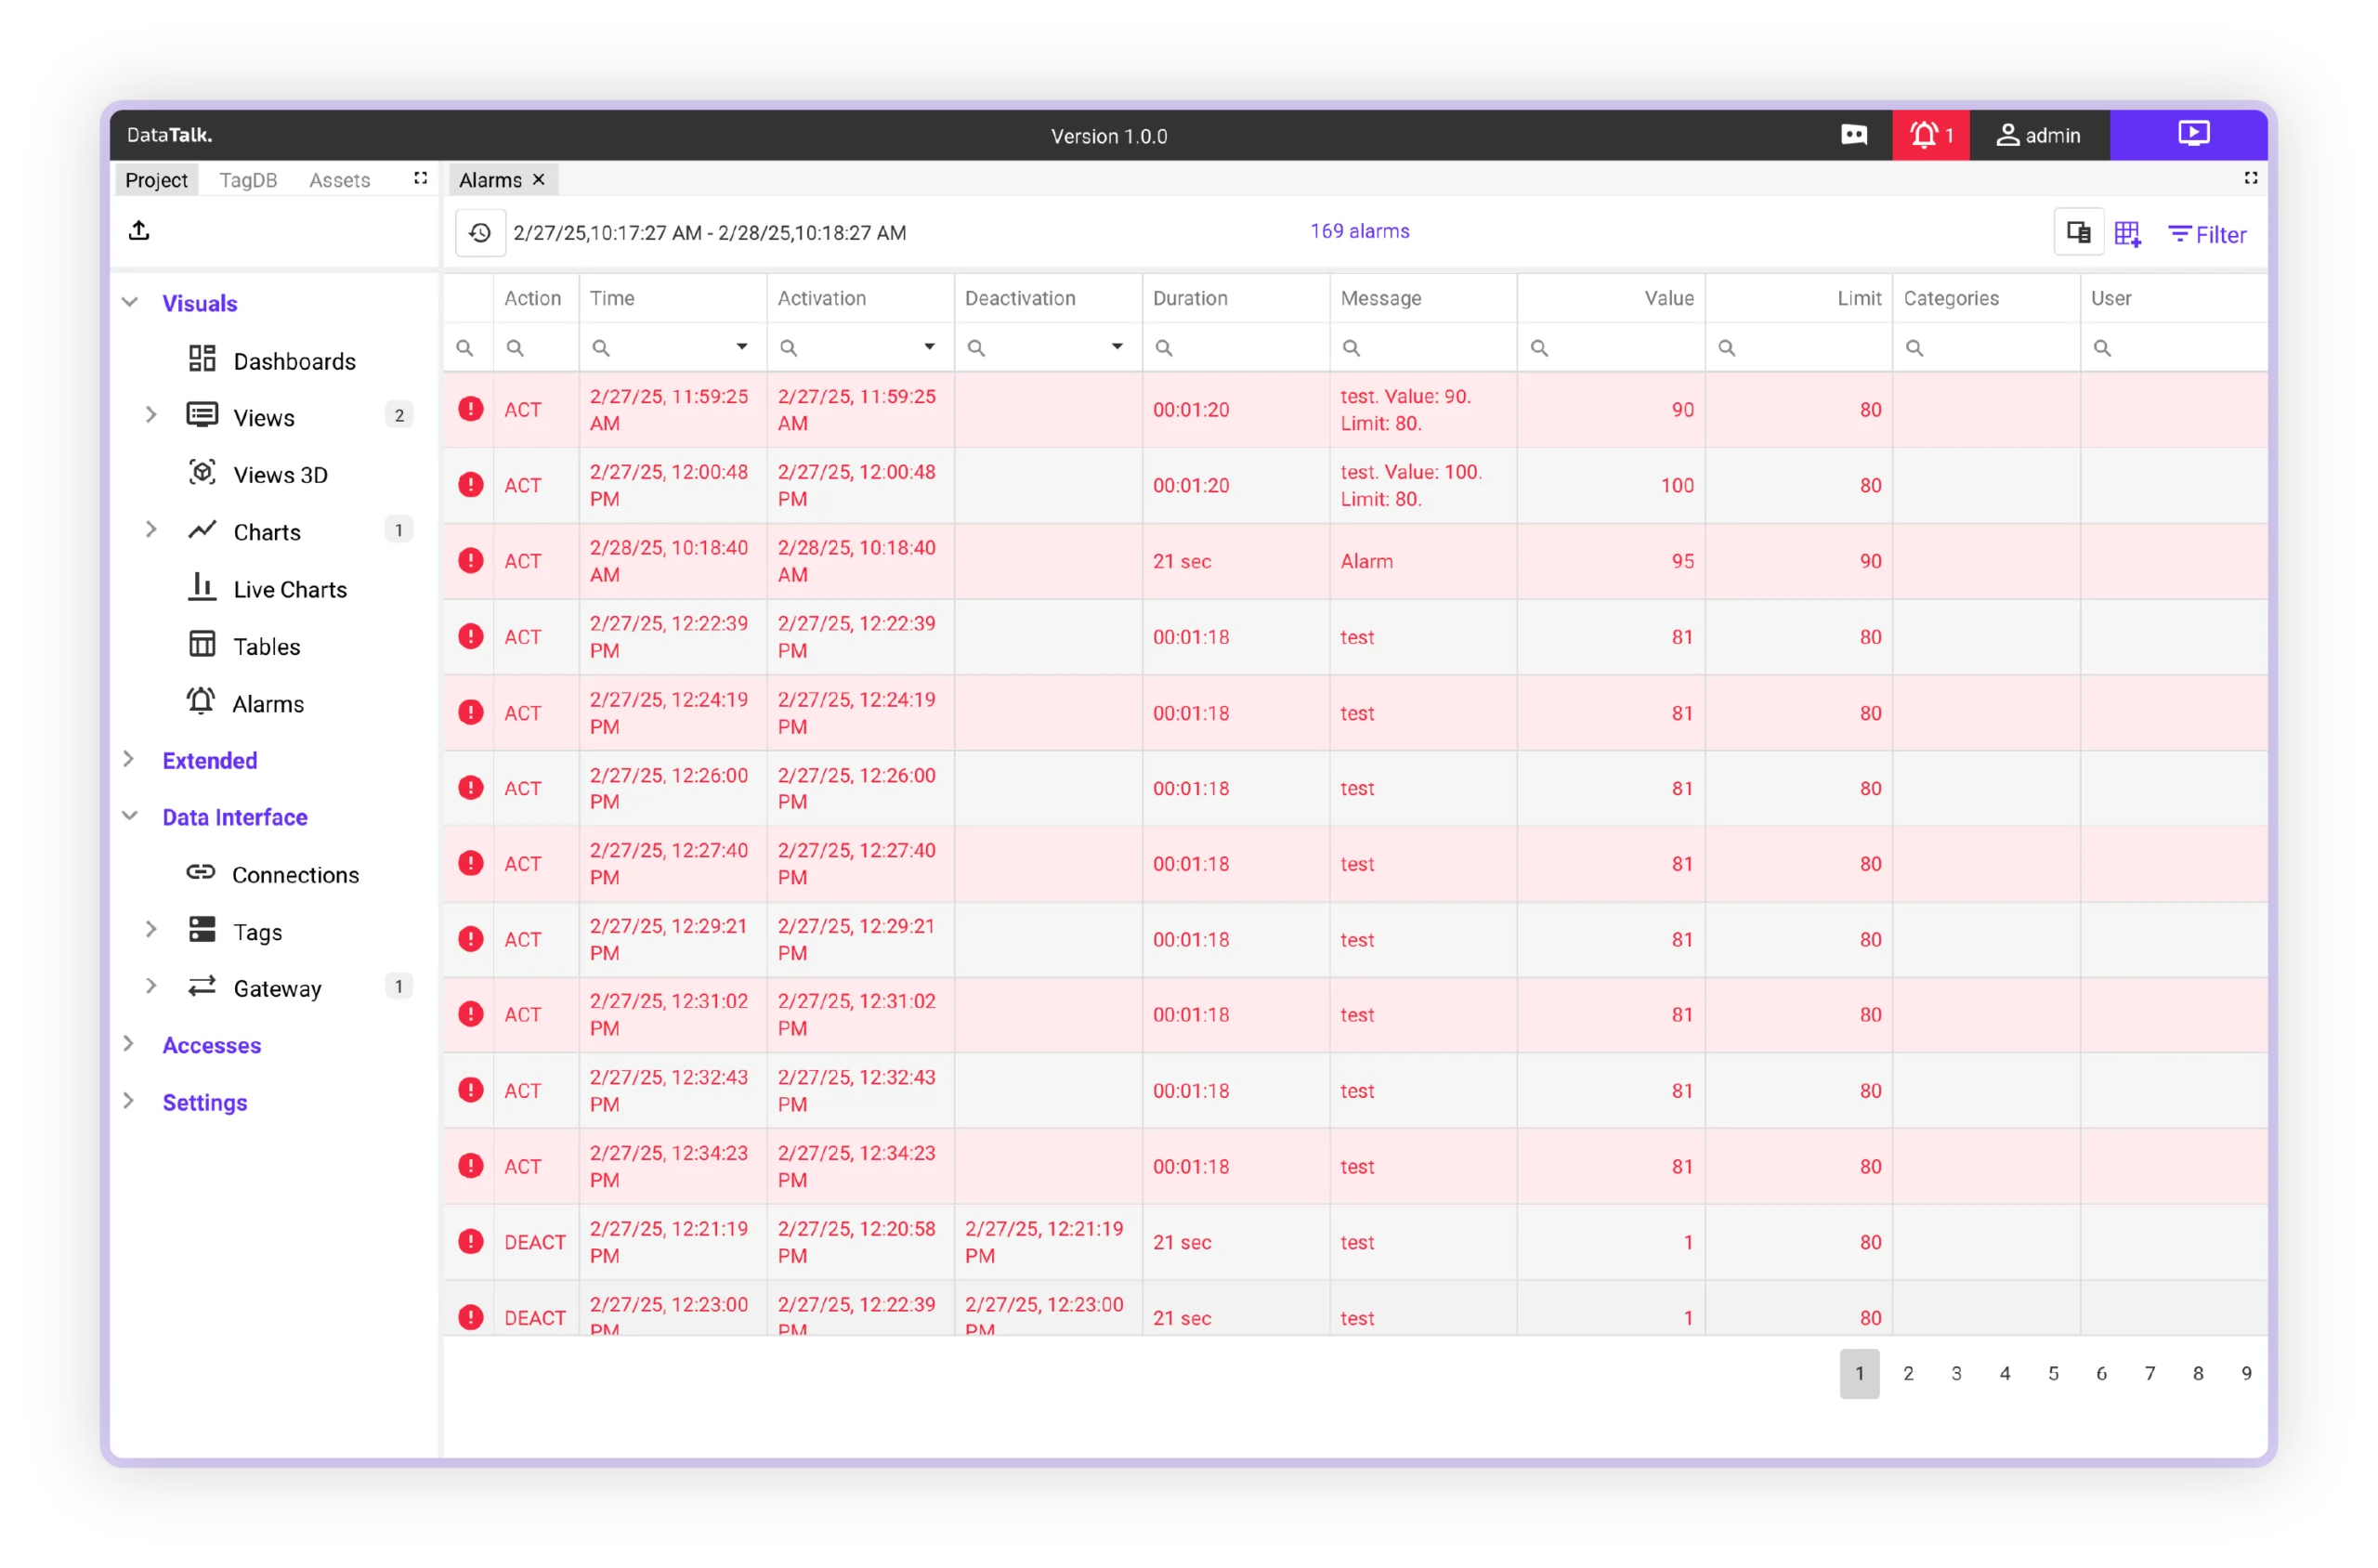
Alarm and notification systems
Real-Time Alarms: Configure triggers and priority-based alerts to keep operators informed of critical events.
Smart Notifications: Send alerts through multiple channels including email, WhatsApp, Slack, and others.
Multiuser Access: Enable true multiuser environments with role-based permissions.

03
Real-time dashboards
Extensive Component Library: Utilize over 200 graphical components for diverse visualization needs.
Integrated Visualizations: Combine charts, tables, and other tools into comprehensive dashboards.
Responsive Design: Enjoy auto-adapting layouts for seamless access on tablets, desktops, and smartphones.
Consistent Experience: Ensure a uniform interface across all devices and screen sizes.
04
3D views
Seamless Importing: Easily incorporate 3D models from formats like STEP7, Ingress, GLB, and more.
Realistic Animations: Bring processes to life with animated 3D objects reflecting real-world system states.
Interactive Navigation: Explore 3D environments intuitively with zoom, pan,and rotate controls via touch or mouse.
Augmented Insights: Overlay sensor data and alarm values directly onto 3D objects for unparalleled situational awareness.
05
2D views
Vivid Vector Graphics: Experience crisp, scalable visuals with precision at any resolution.
Intuitive GUI Editor: Design and edit layouts effortlessly with drag-and-drop functionality, grids, tree object views and context-aware tools.
Dynamic Interactions: Integrate animations, interactive elements and live data bindings for real-time feedback and control.
06
Advanced visual components
Powerful Charting Tools: Generate detailed graphs with aggregation capabilities for trend analysis and reporting.
Live & Historical Tables: Display data in an organized, tabular format.
Rich Component Library: Access gauges, displays, buttons, P&ID symbols, icons and more to customize your interface.

07
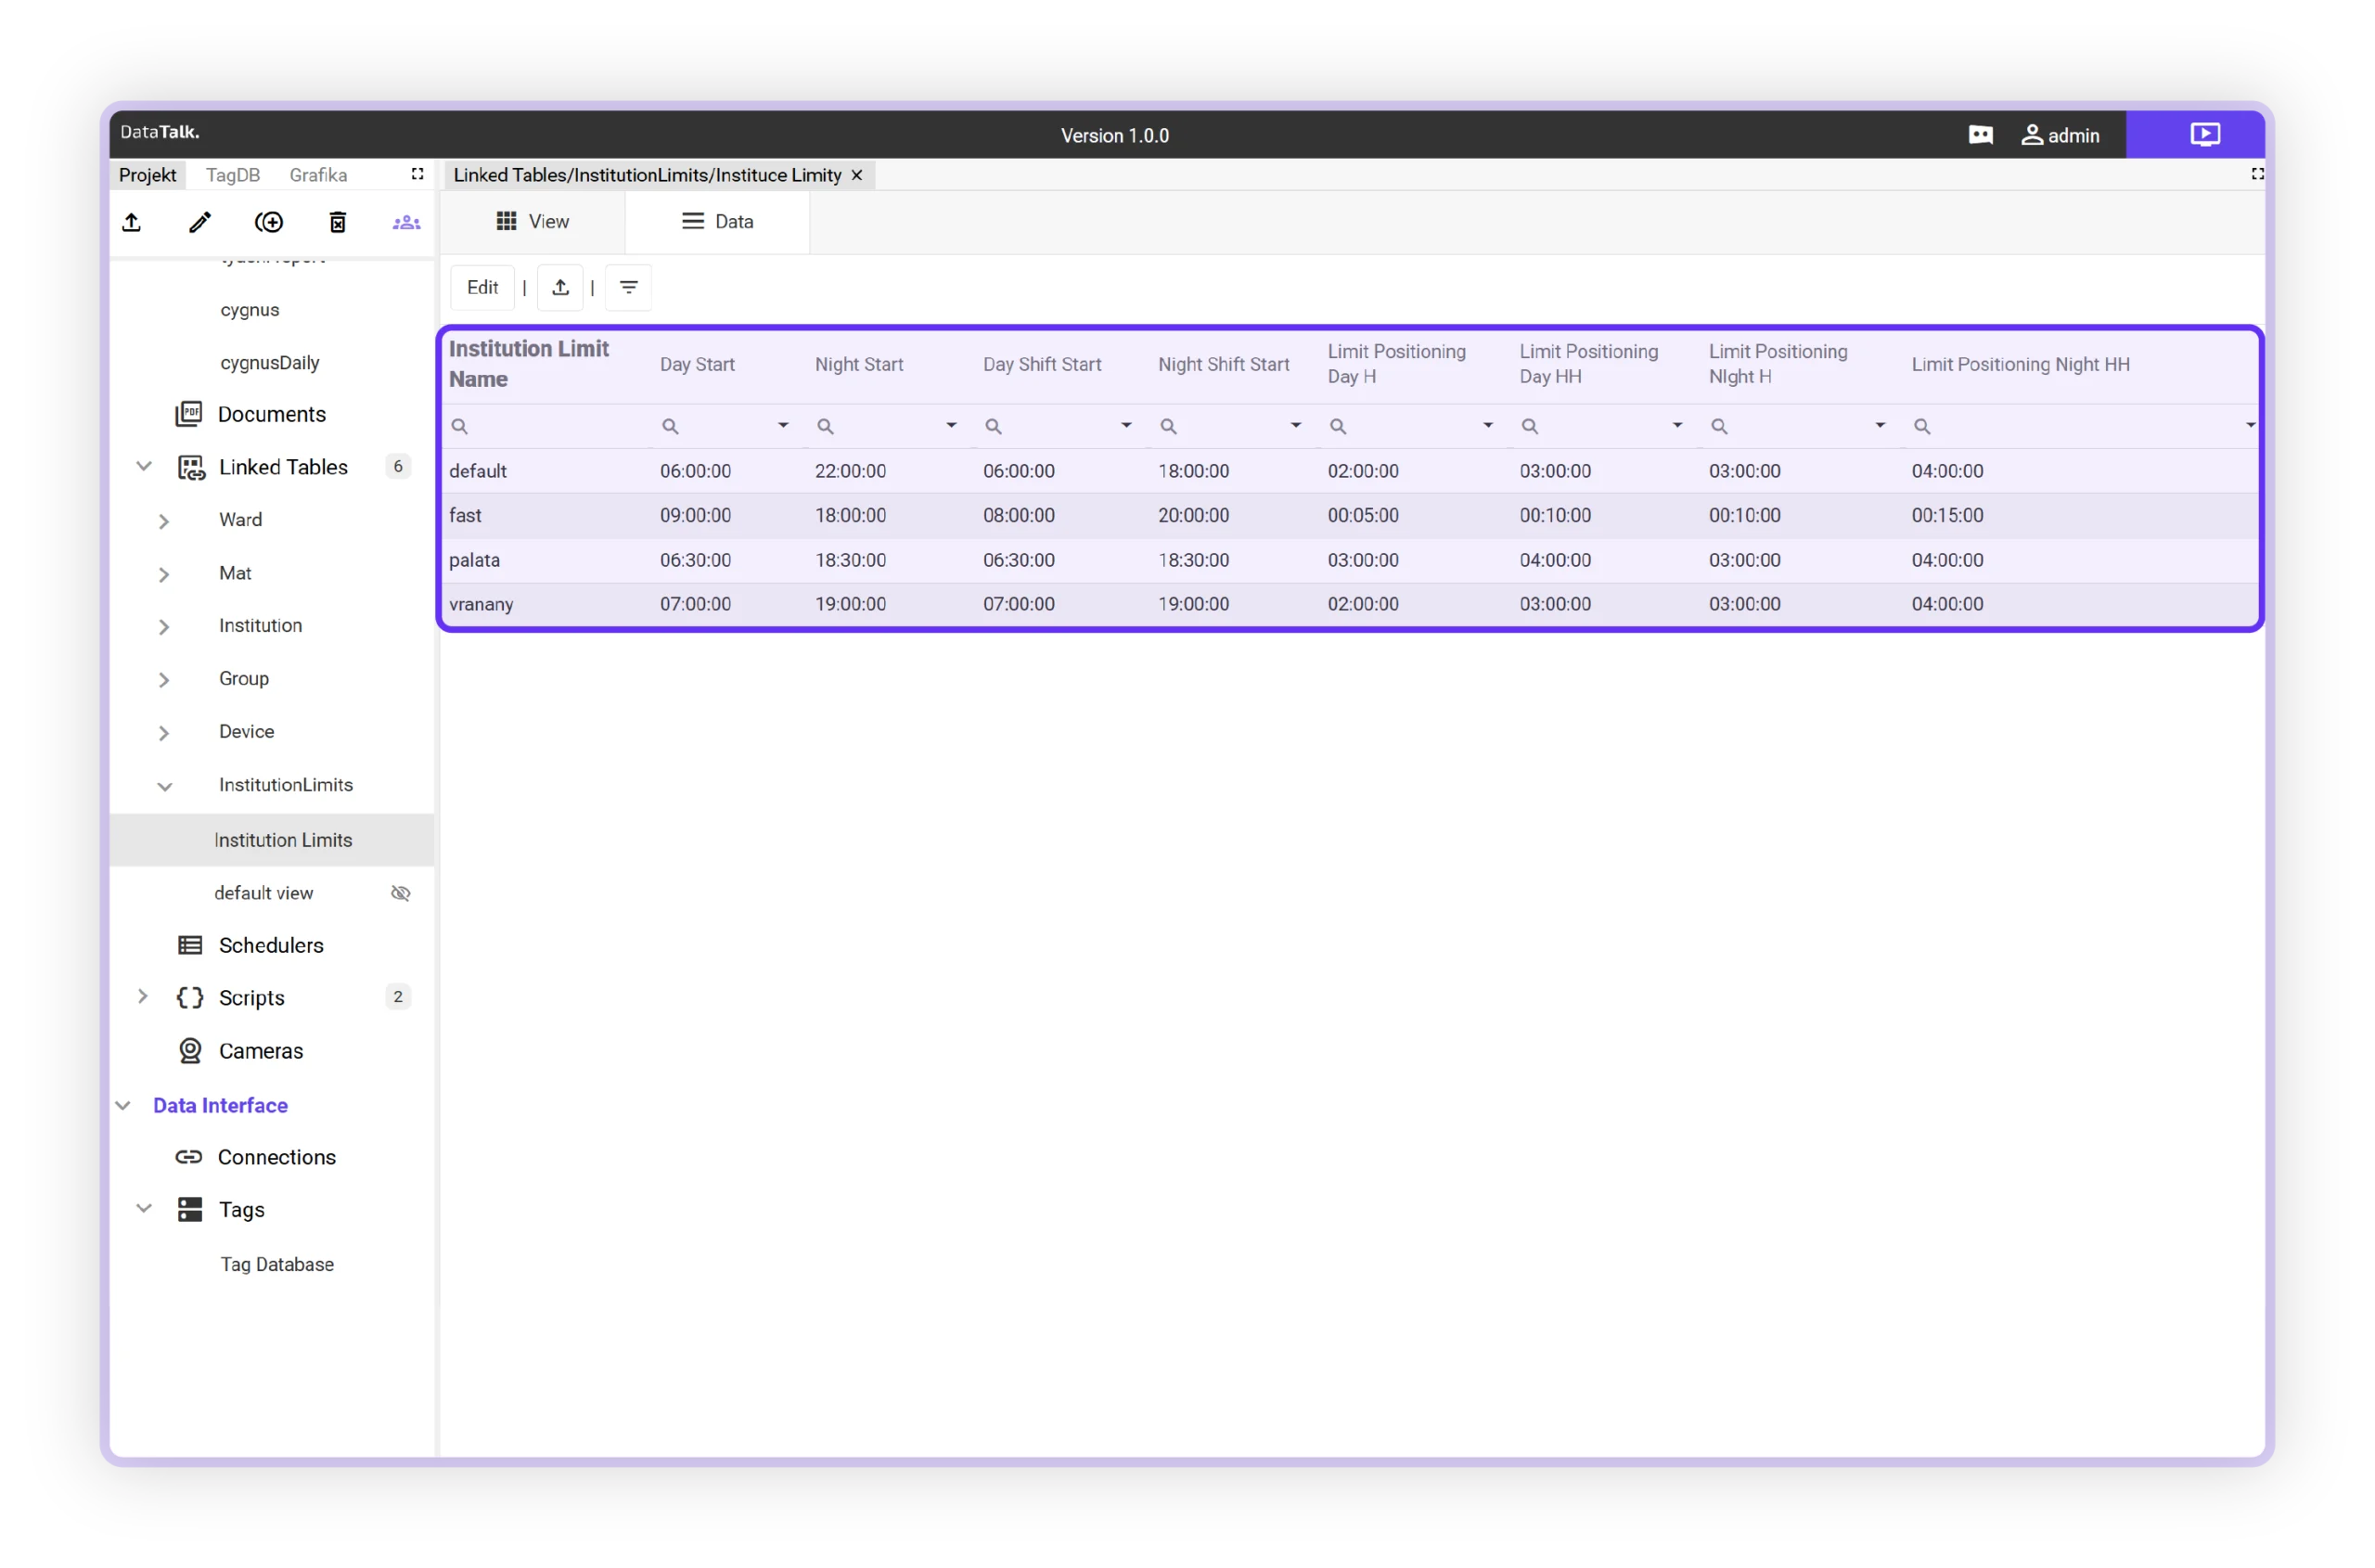
Linked tables & recipes
Effortlessly create and define data tables with mutual dependencies.
Flexible Data Structures: Design custom data structures and organize hierarchies (e.g., Factory → Hall → Line → Machine).
Live Data Binding: Bind tables with real-time data sources for use cases like recipe management.
Custom Views & Logic: Define multiple data views (time-based, event-based, etc.) and utilize scripting for complex logic when needed.
08
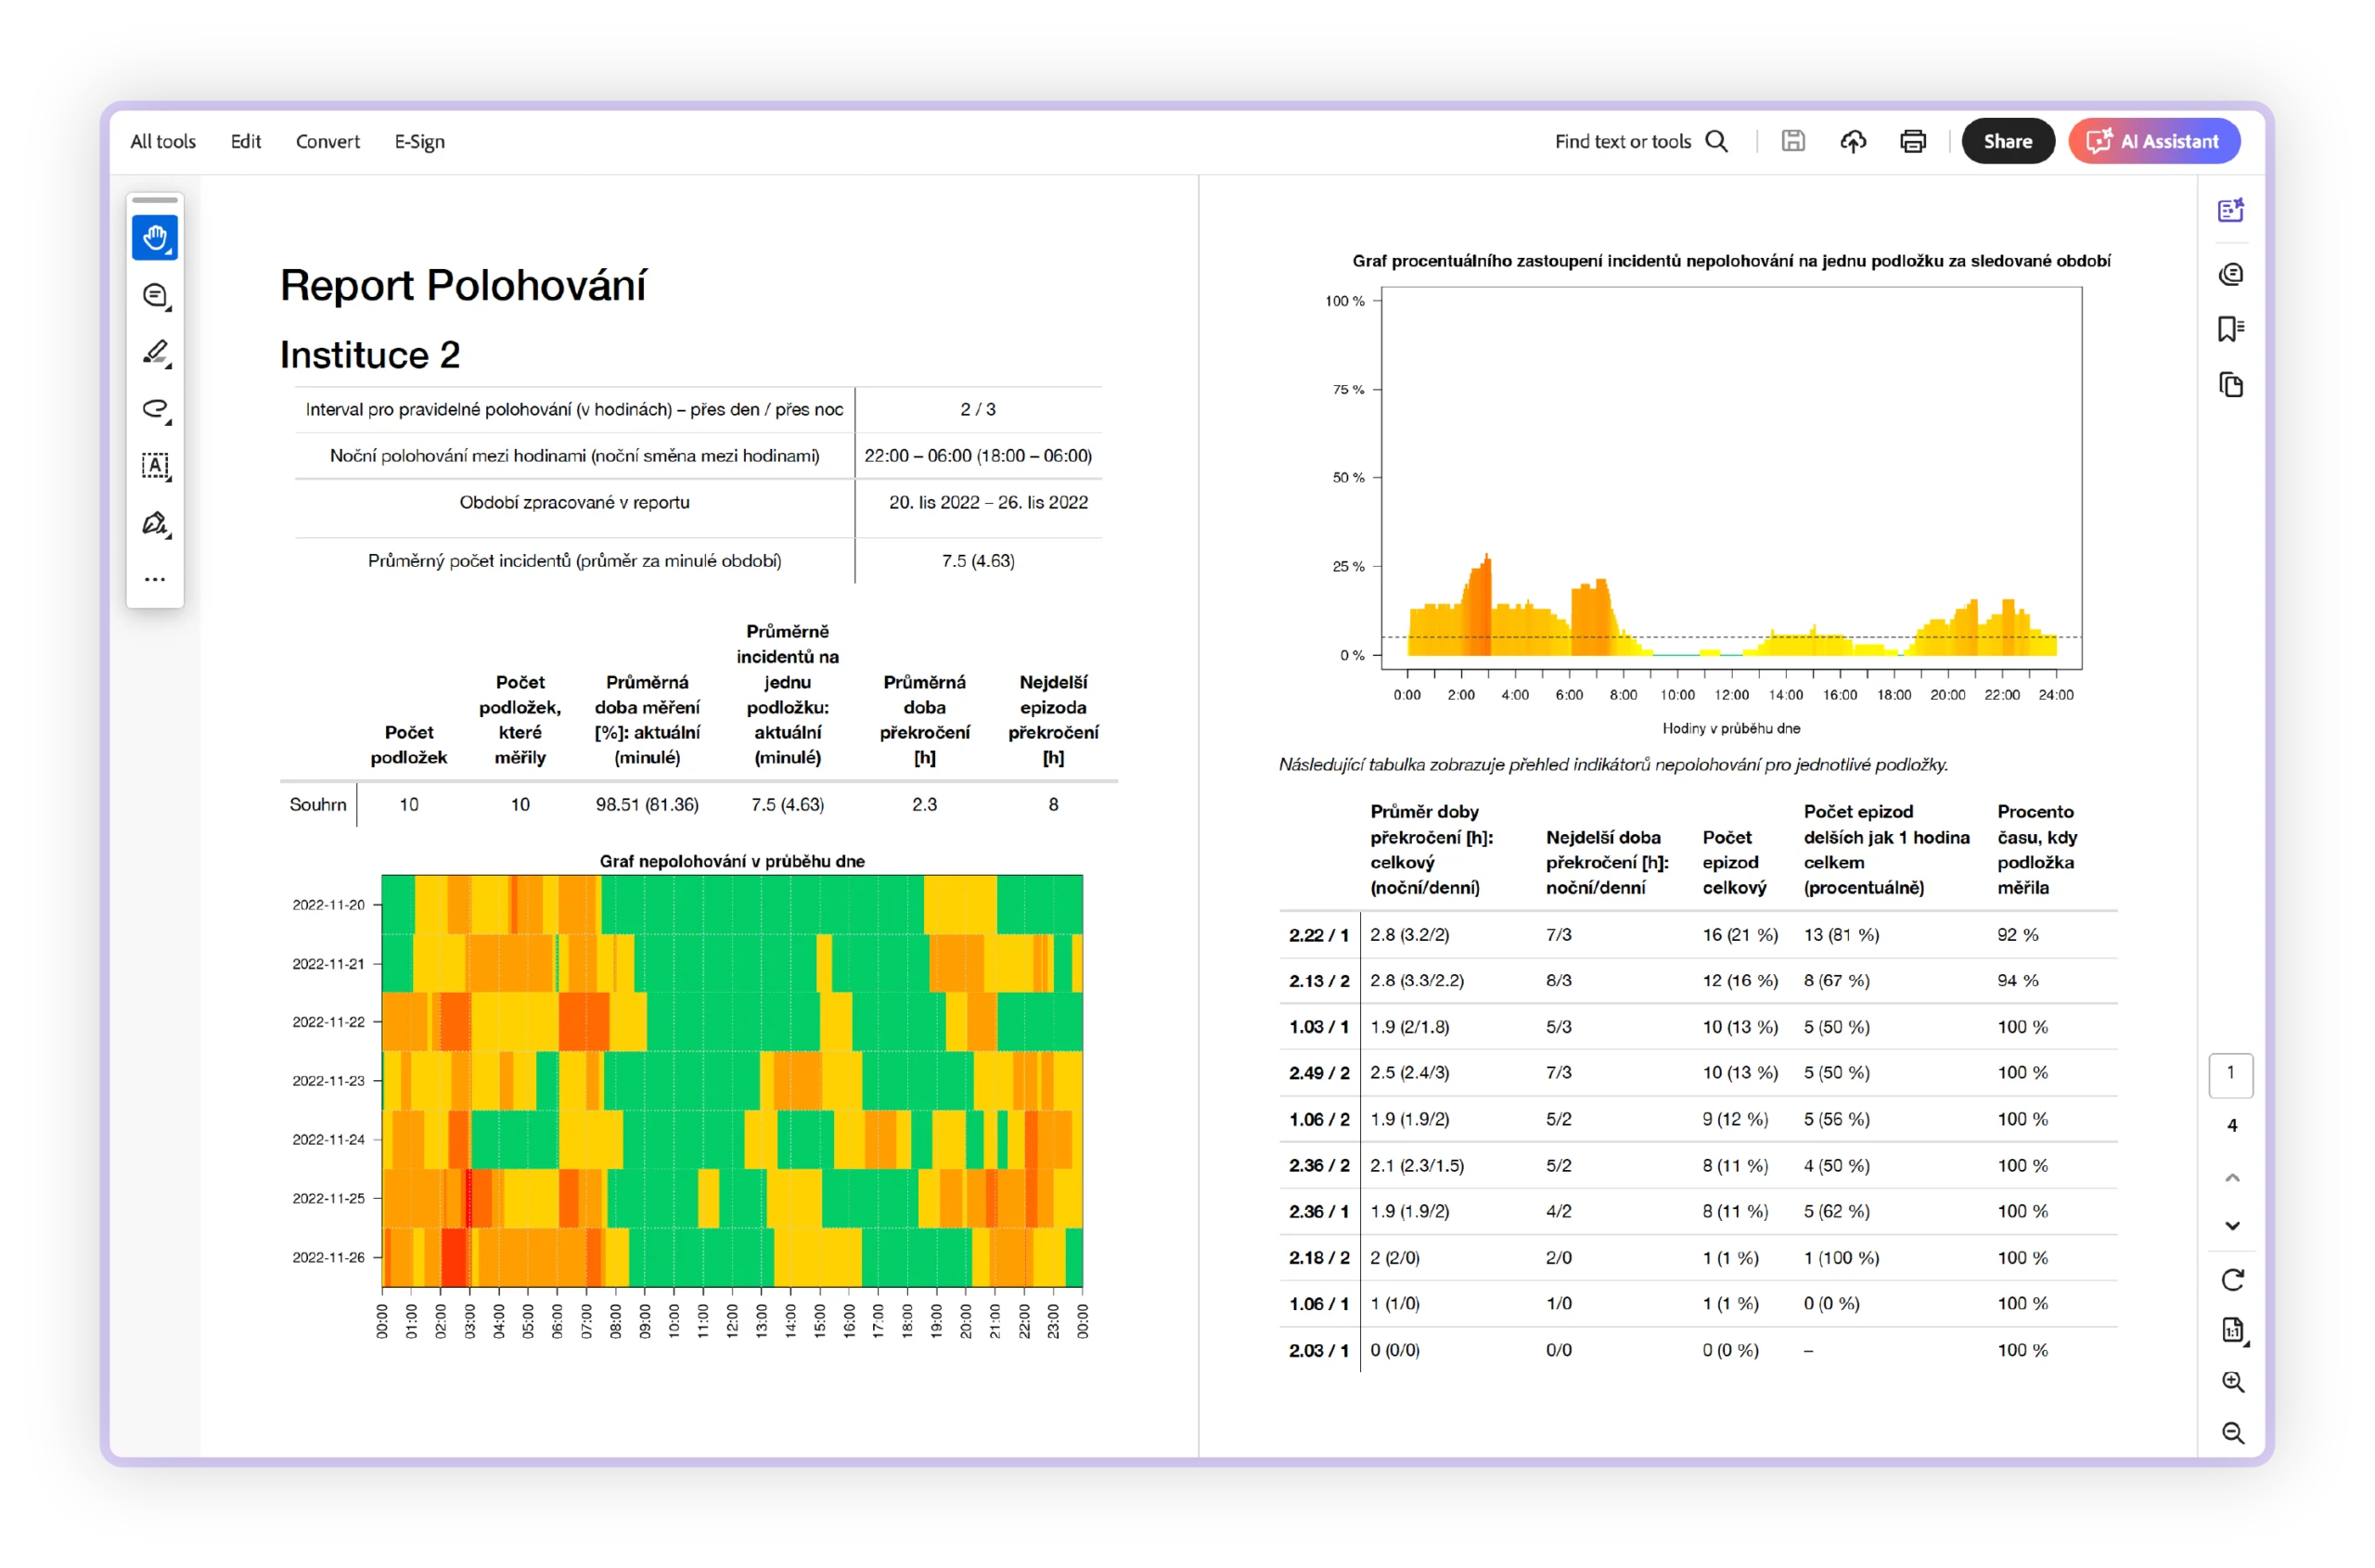
Reports
Generate, customize, and automate reporting with ease.
Live & Historical Tables: Display data in an organized, tabular format.
Flexible Export Options: Export reports in various formats, including PDF, Word, and Excel.
Seamless Distribution: Distribute reports via email, WhatsApp, Slack, Discord or other communication platforms.

09
No-code scripting
Combine data, create new variables, and build complex logic effortlessly—without writing code.
Predefined Function Blocks: Automate processes quickly and efficiently using ready-to-use function blocks.
Real-Time & Historical Analysis: Interact with live data, analyze trends and implement custom logic with built-in scripting.
In-Browser Debugging: Identify and resolve issues instantly with integrated debugging tools.
10
Gateway
Connect SCADA data with external IT systems and cloud platforms effortlessly.
Real-Time Data Publishing: Utilize an integrated gateway to share live data with third-party systems.
Built-In REST API: Enable smooth interoperability with external applications through a powerful REST API.
Trusted by:
Pricing
Licences
Our pricing is determined by the project size (number of tags), while everything else is unlimited. All product features are included. No hidden costs, just a clear, fair deal.
Personal
For non-commercial projects only.
€0
Lifetime license *
- Unlimited number of clients
- 50 Tags
- Community support
S
For small and mid-sized projects.
€3 100
Lifetime license *
- Unlimited number of clients
- 1 500 Tags
- Limited support
M
For mid to large projects with no compromise.
€8 600
Lifetime license *
- Unlimited number of clients
- 10 000 Tags
- Full support
L
Unlock the unlimited world of experiences.
€
On request
Lifetime license *
- Unlimited number of clients
- UNLIMITED Tags
- Premium support
Modules included in DataTalk AI SCADA product:
Data In
Compute
Data logging
Project Designer
AI
Alarm
Notification
Dashboards
Report
Scripting
Redundancy
Gateway
API
Linked tables
Visualizations
IP Camera
Schedulers
Documentation
Components
Cloud
* Updates are free for 1 year. After 1 year, the price of updates is 20% of the license price annually.
Community support – e.g., forums, basic FAQs / Limited support – email, three working days response / Full support – email, one working day response, SLA option / Premium support – priority email and phone support, live chat support – direct access to one of our technicians, SLA option.
Get in touch
Your feedback matters
Whether it’s a question, suggestion, or compliment, we’re here to listen. Reach out via contact form. We’ll get back to you promptly.
main office
Velvarská 1699/29
160 00 Prague
Czech Republic
Legal office
Na Kodymce 973/1
160 00 Prague
Czech Republic