The Table feature provides a convenient way to monitor and record data points (tags) from the Tags Database. This tool checks the selected data points periodically and updates the table if any changes in their values are detected.

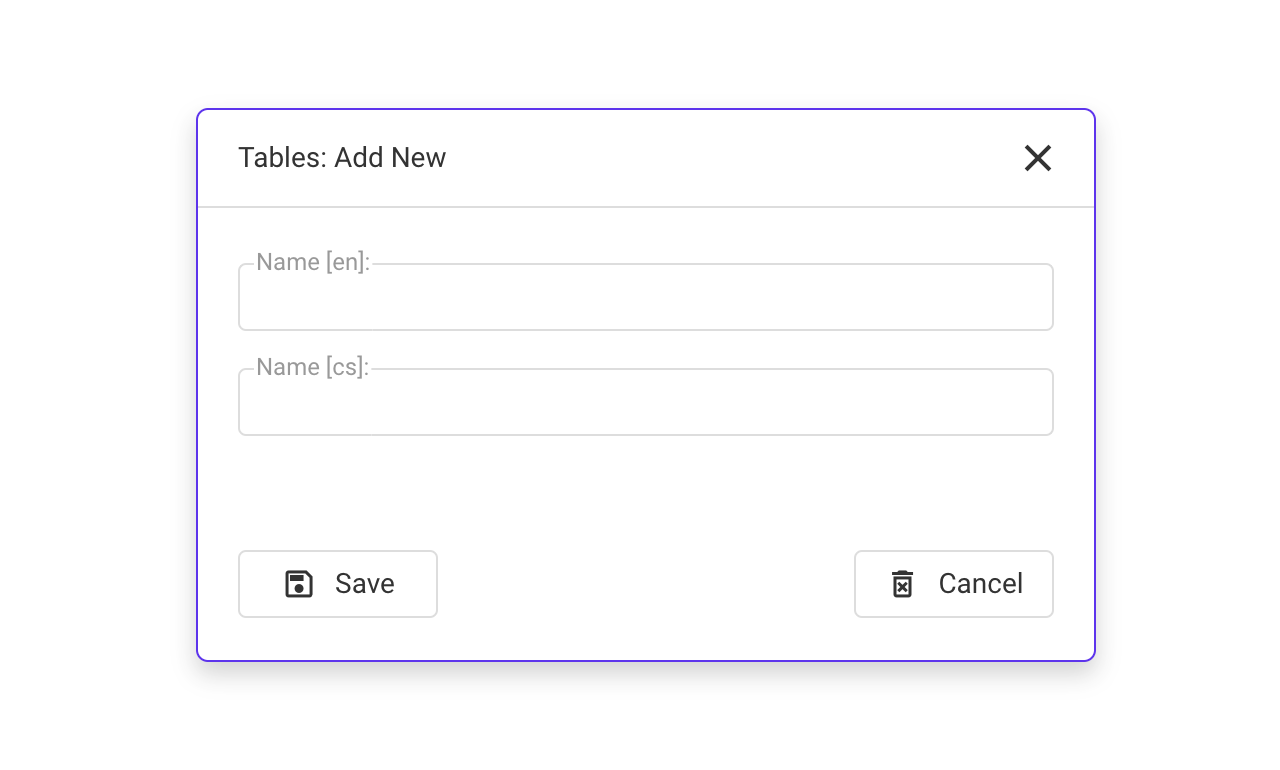
1. Create a New Table: Click the “plus” icon and enter a name for your new table.

2. Add Tags: You can easily drag tags from the tags tree or manually add them to the designated area on the right side.
3. Dynamic Updates: The table will refresh its values based on the time interval set in the log groups, but only when there is a change in the tag’s value.
| Feature | Description |
|---|---|
| Toolbar | Allows selection of the position for a time range, time grouping, and Excel export options. |
| Mode | Restricts the table to selected time modes: Live, History, or both. |
| Other | Contains options to enable or disable the Excel export button. |
| Time select button | If both modes are enabled, you can toggle between live and history modes; in history mode, you can select a date range to display logged data. |
| Time grouping | Allows to shrink the same values that are logged within the specified time range into single one |
gif jak se logují data a padají do toho table