DataTalk Platform
A Universal, No-Code Platform for Operational Excellence
30+
Years of experience
2000+
Active installs
50+
Countries

Satisfaction
About
DataTalk Platform
Complex, flexible, unlimited yet secure.
Explore a new era of industrial monitoring and control with DataTalk’s powerful, AI-enhanced solution. From real-time alerts and seamless OT/IT integration to no-code dashboards and automated reporting, each product is designed to simplify complex processes and maximize efficiency.
Our portfolio
Find the Perfect Fit
CREATE
Build your first project
From a quick demo to a full project
Describe what you want to monitor and control, and let AI Engineer create the screens and configure the components. Whether you’re trying out an idea or starting a full project, you can get going without learning every corner of DataTalk first.

Alarm & Notify
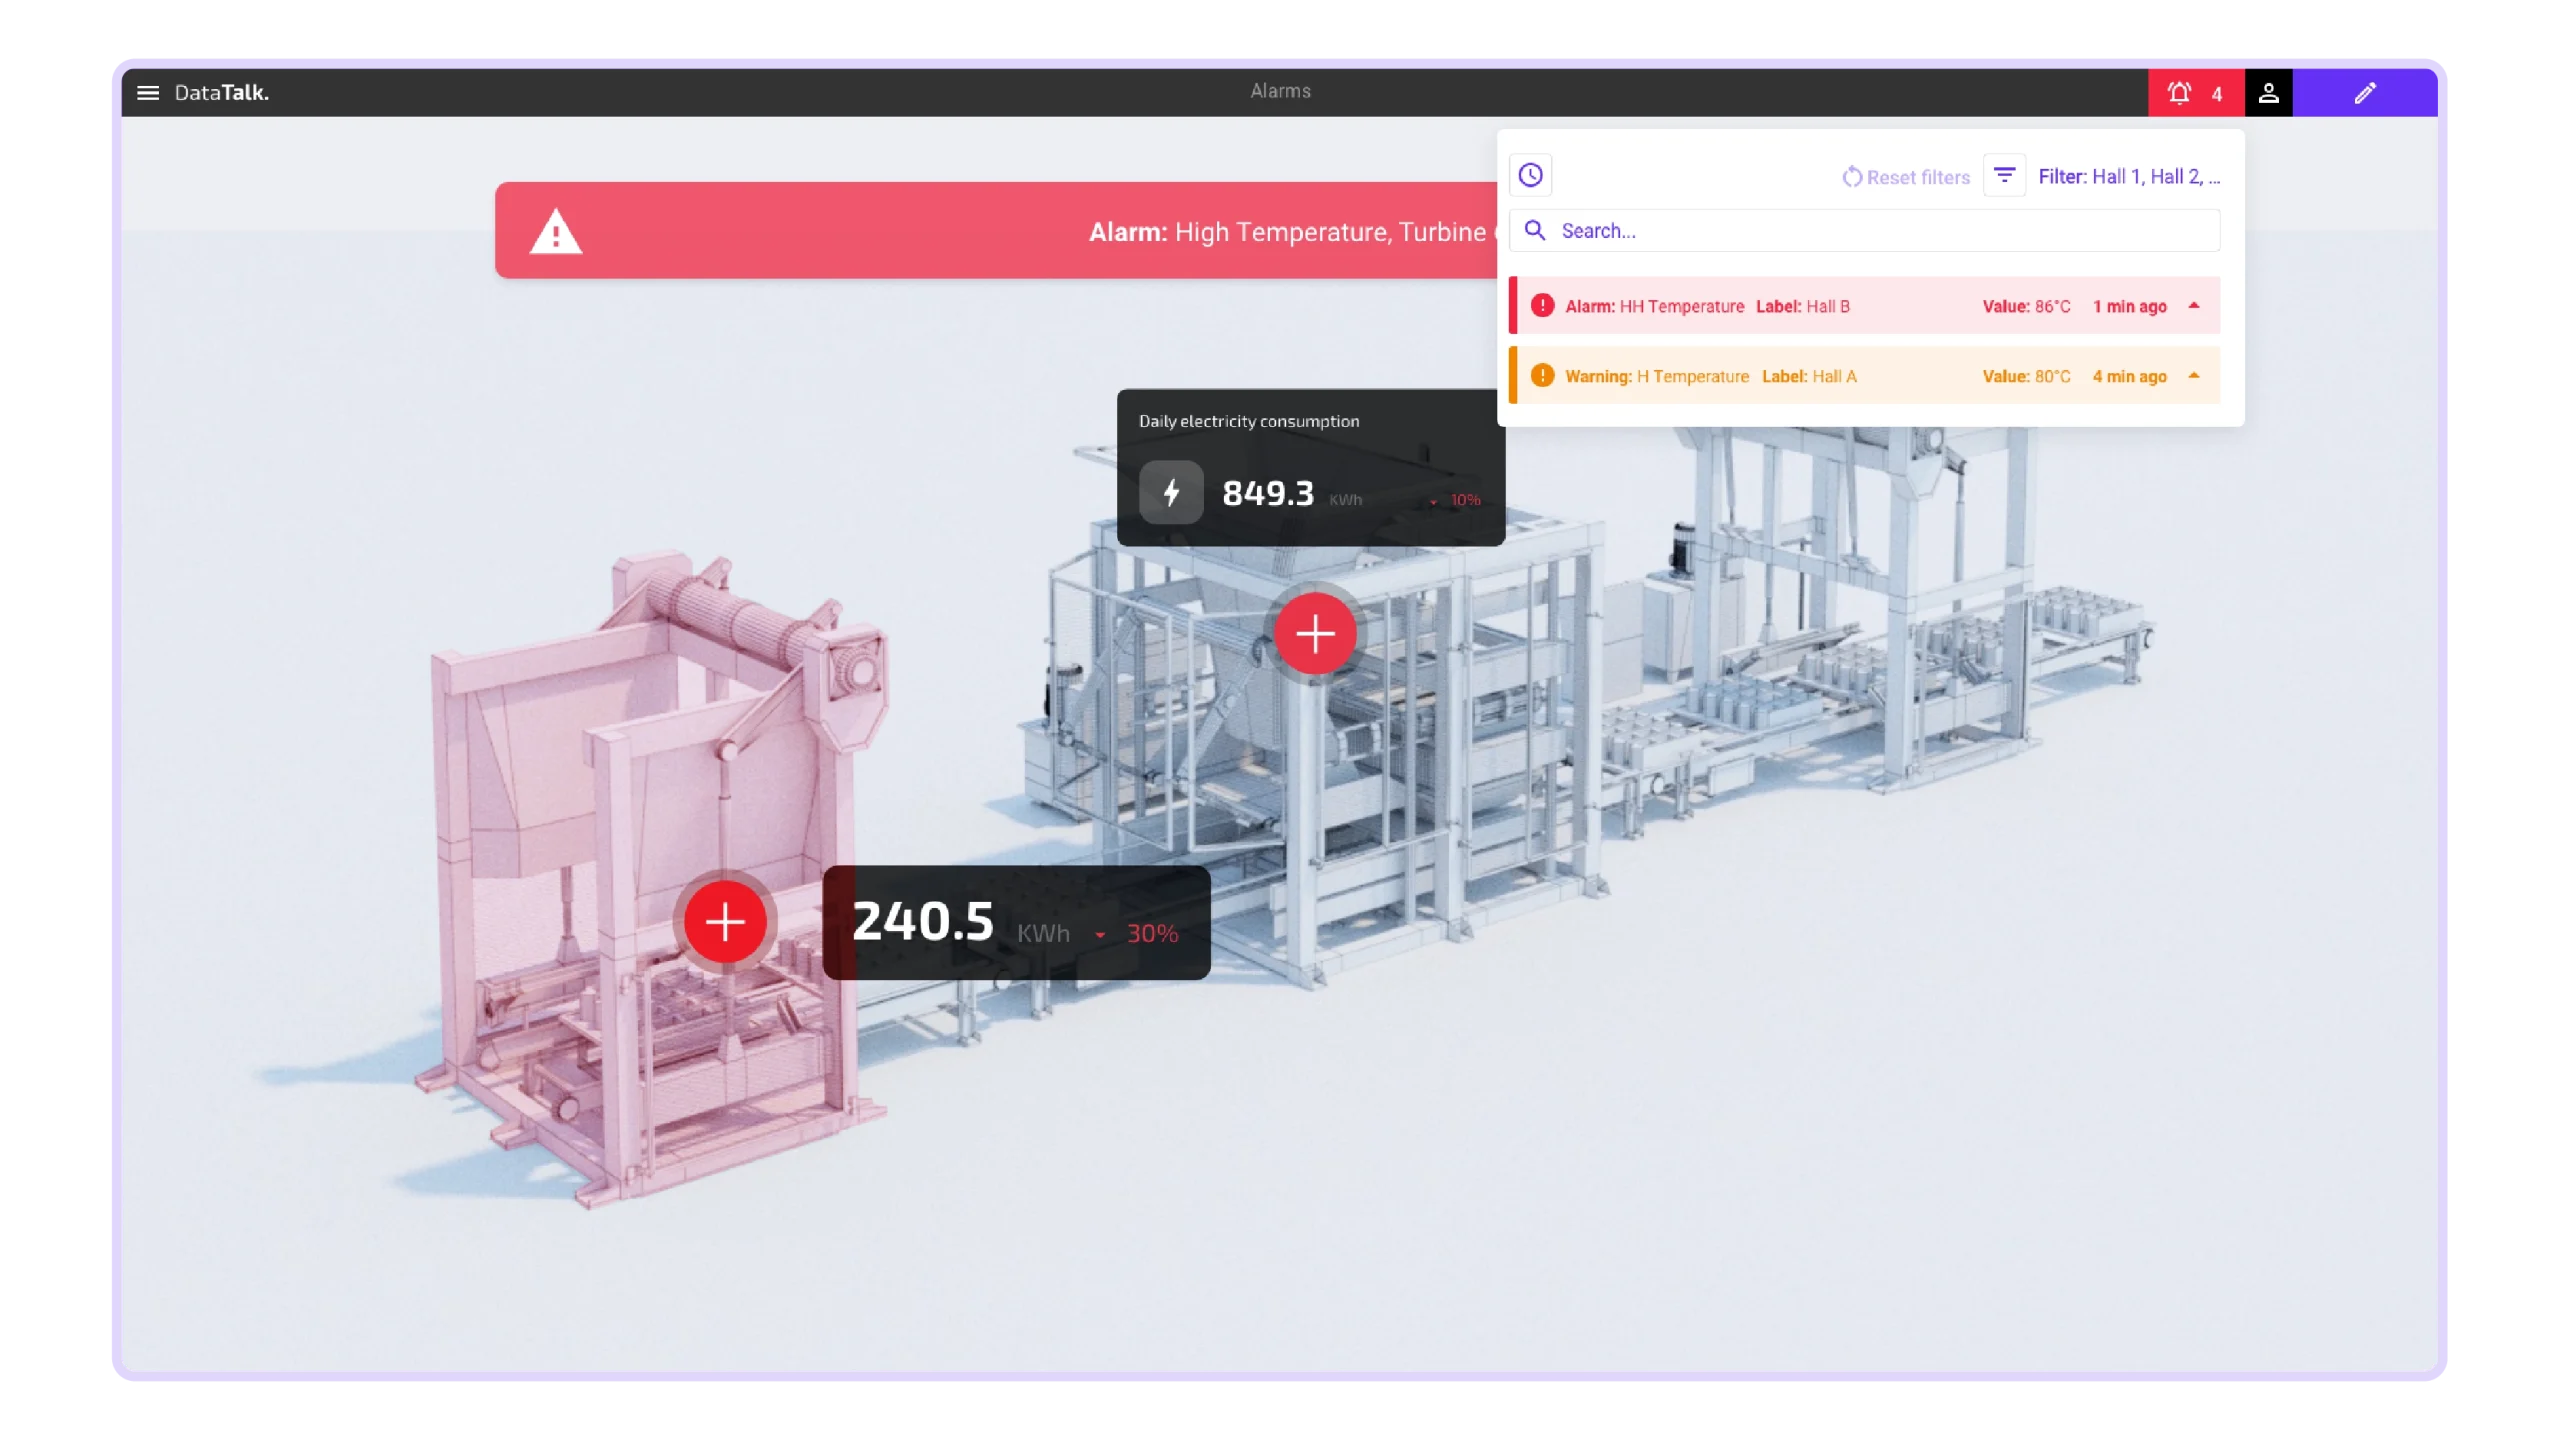
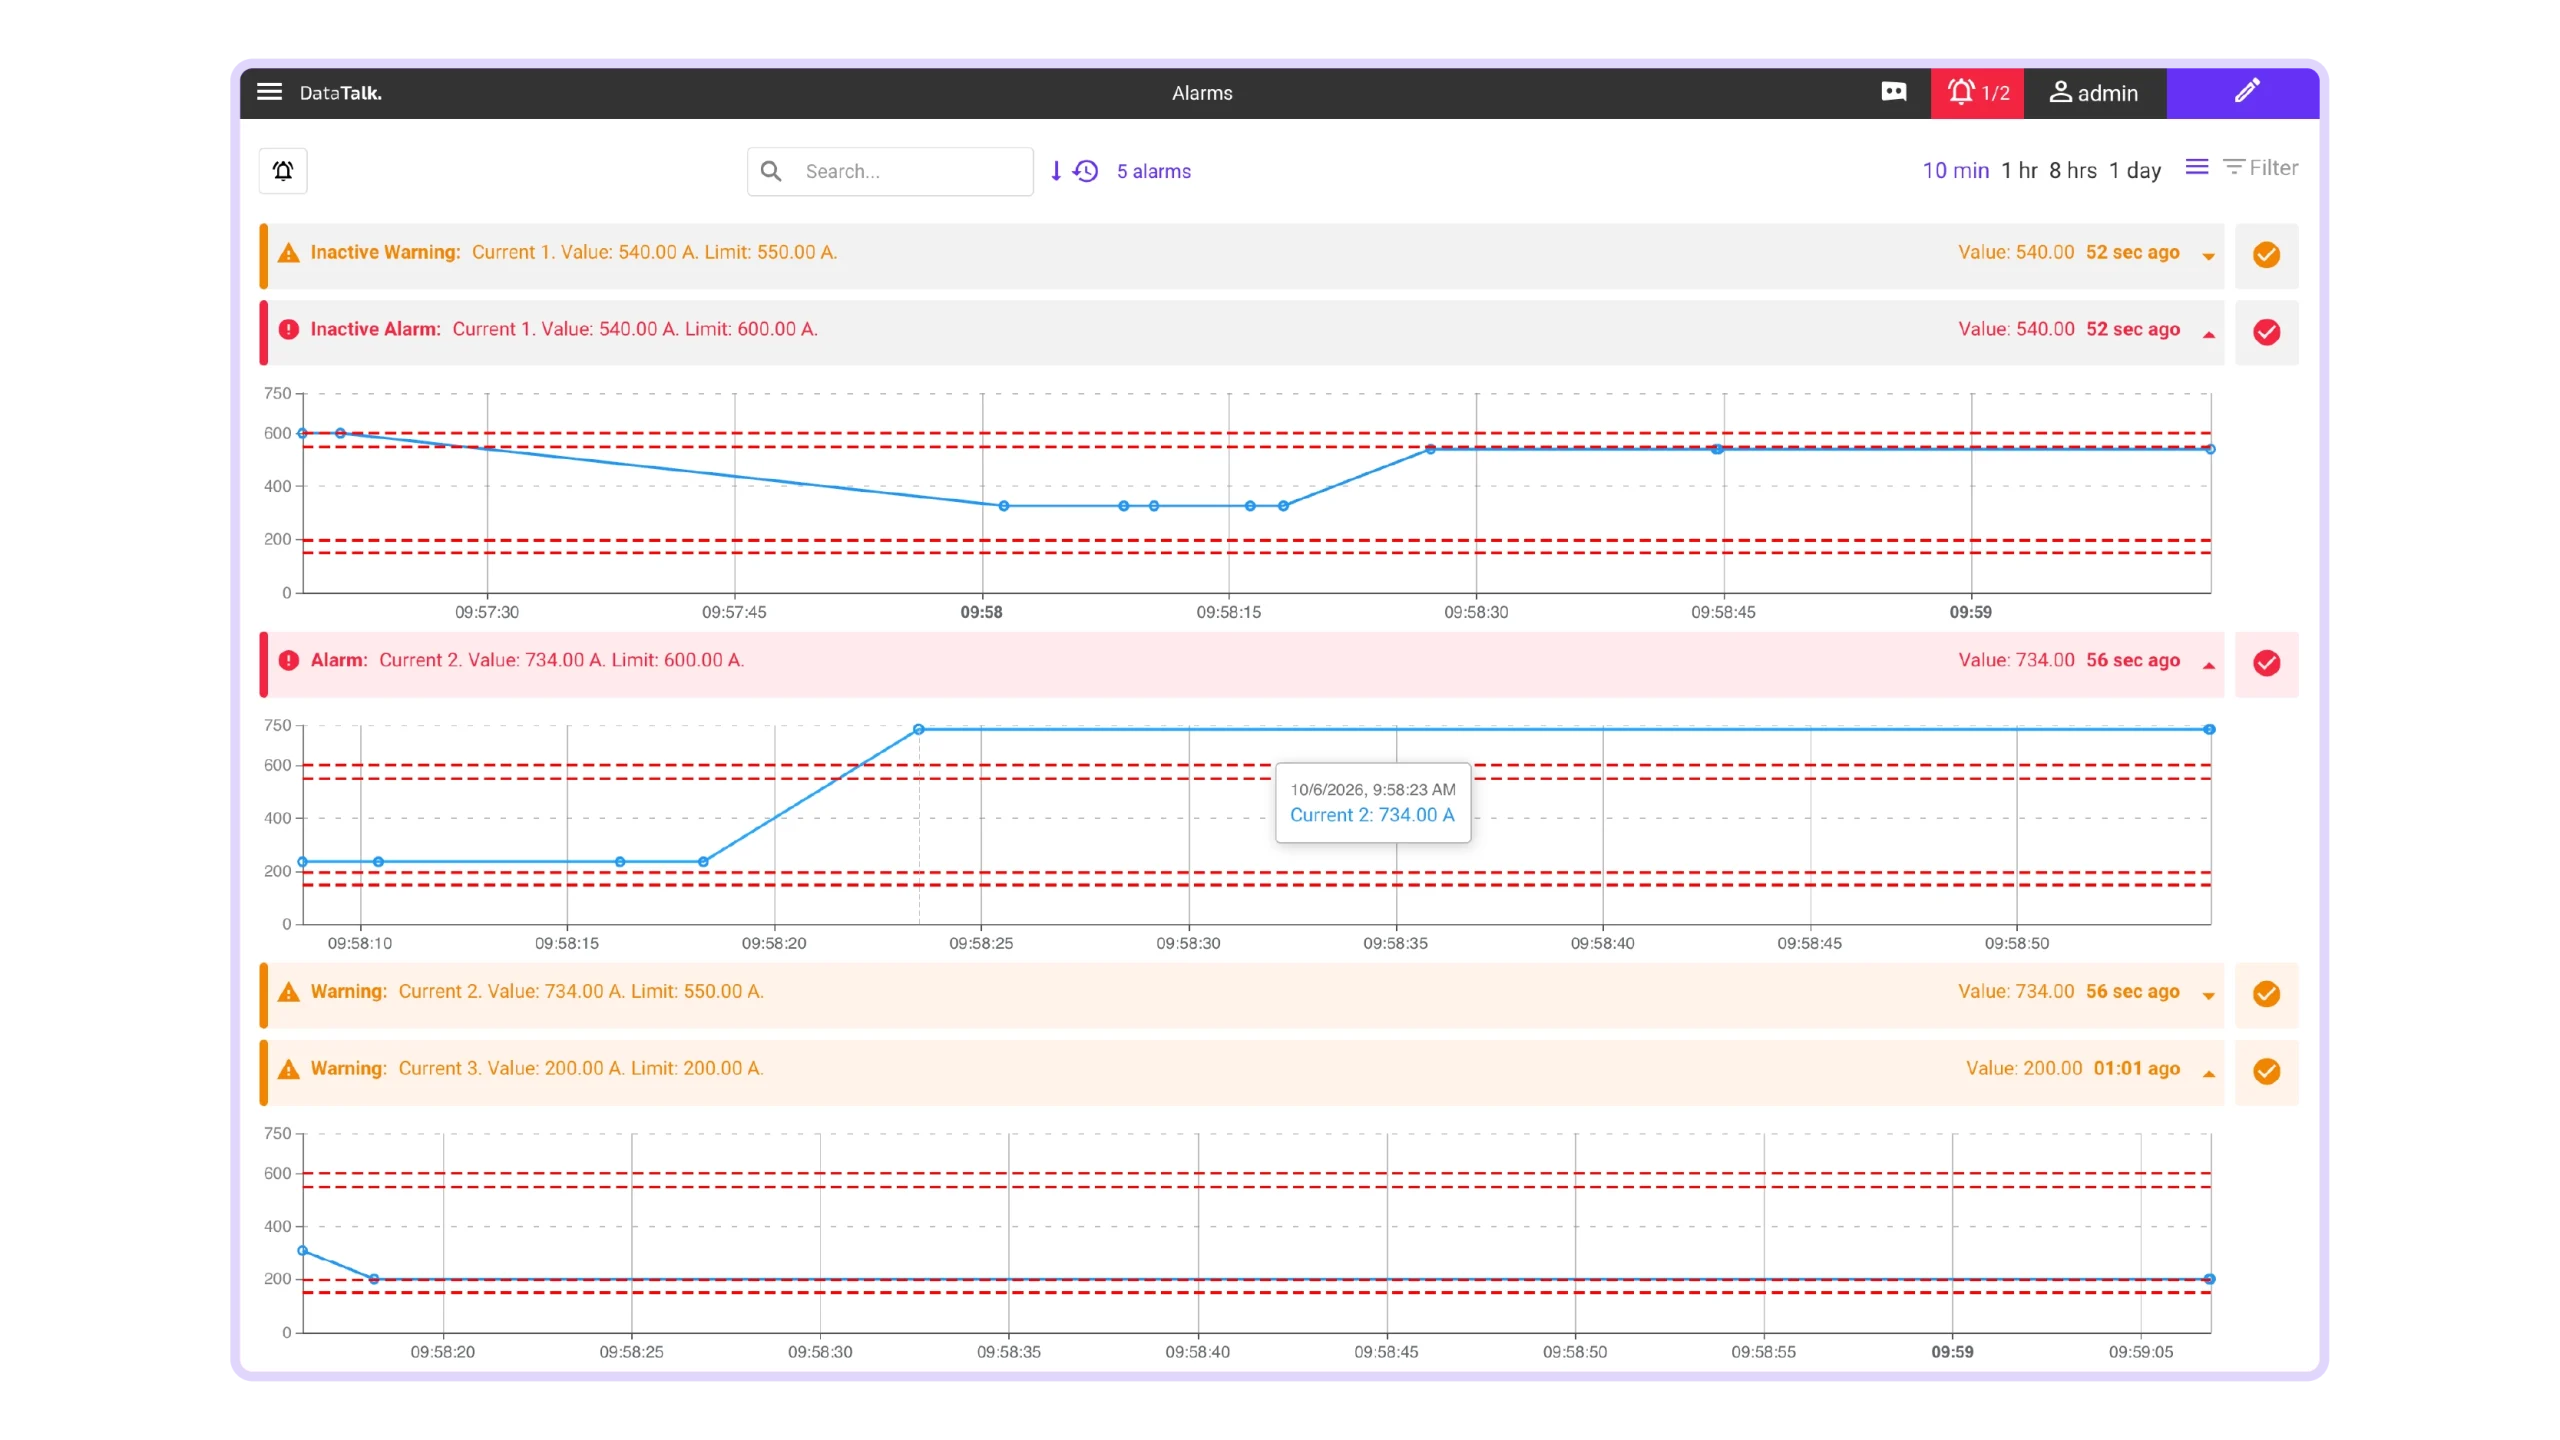
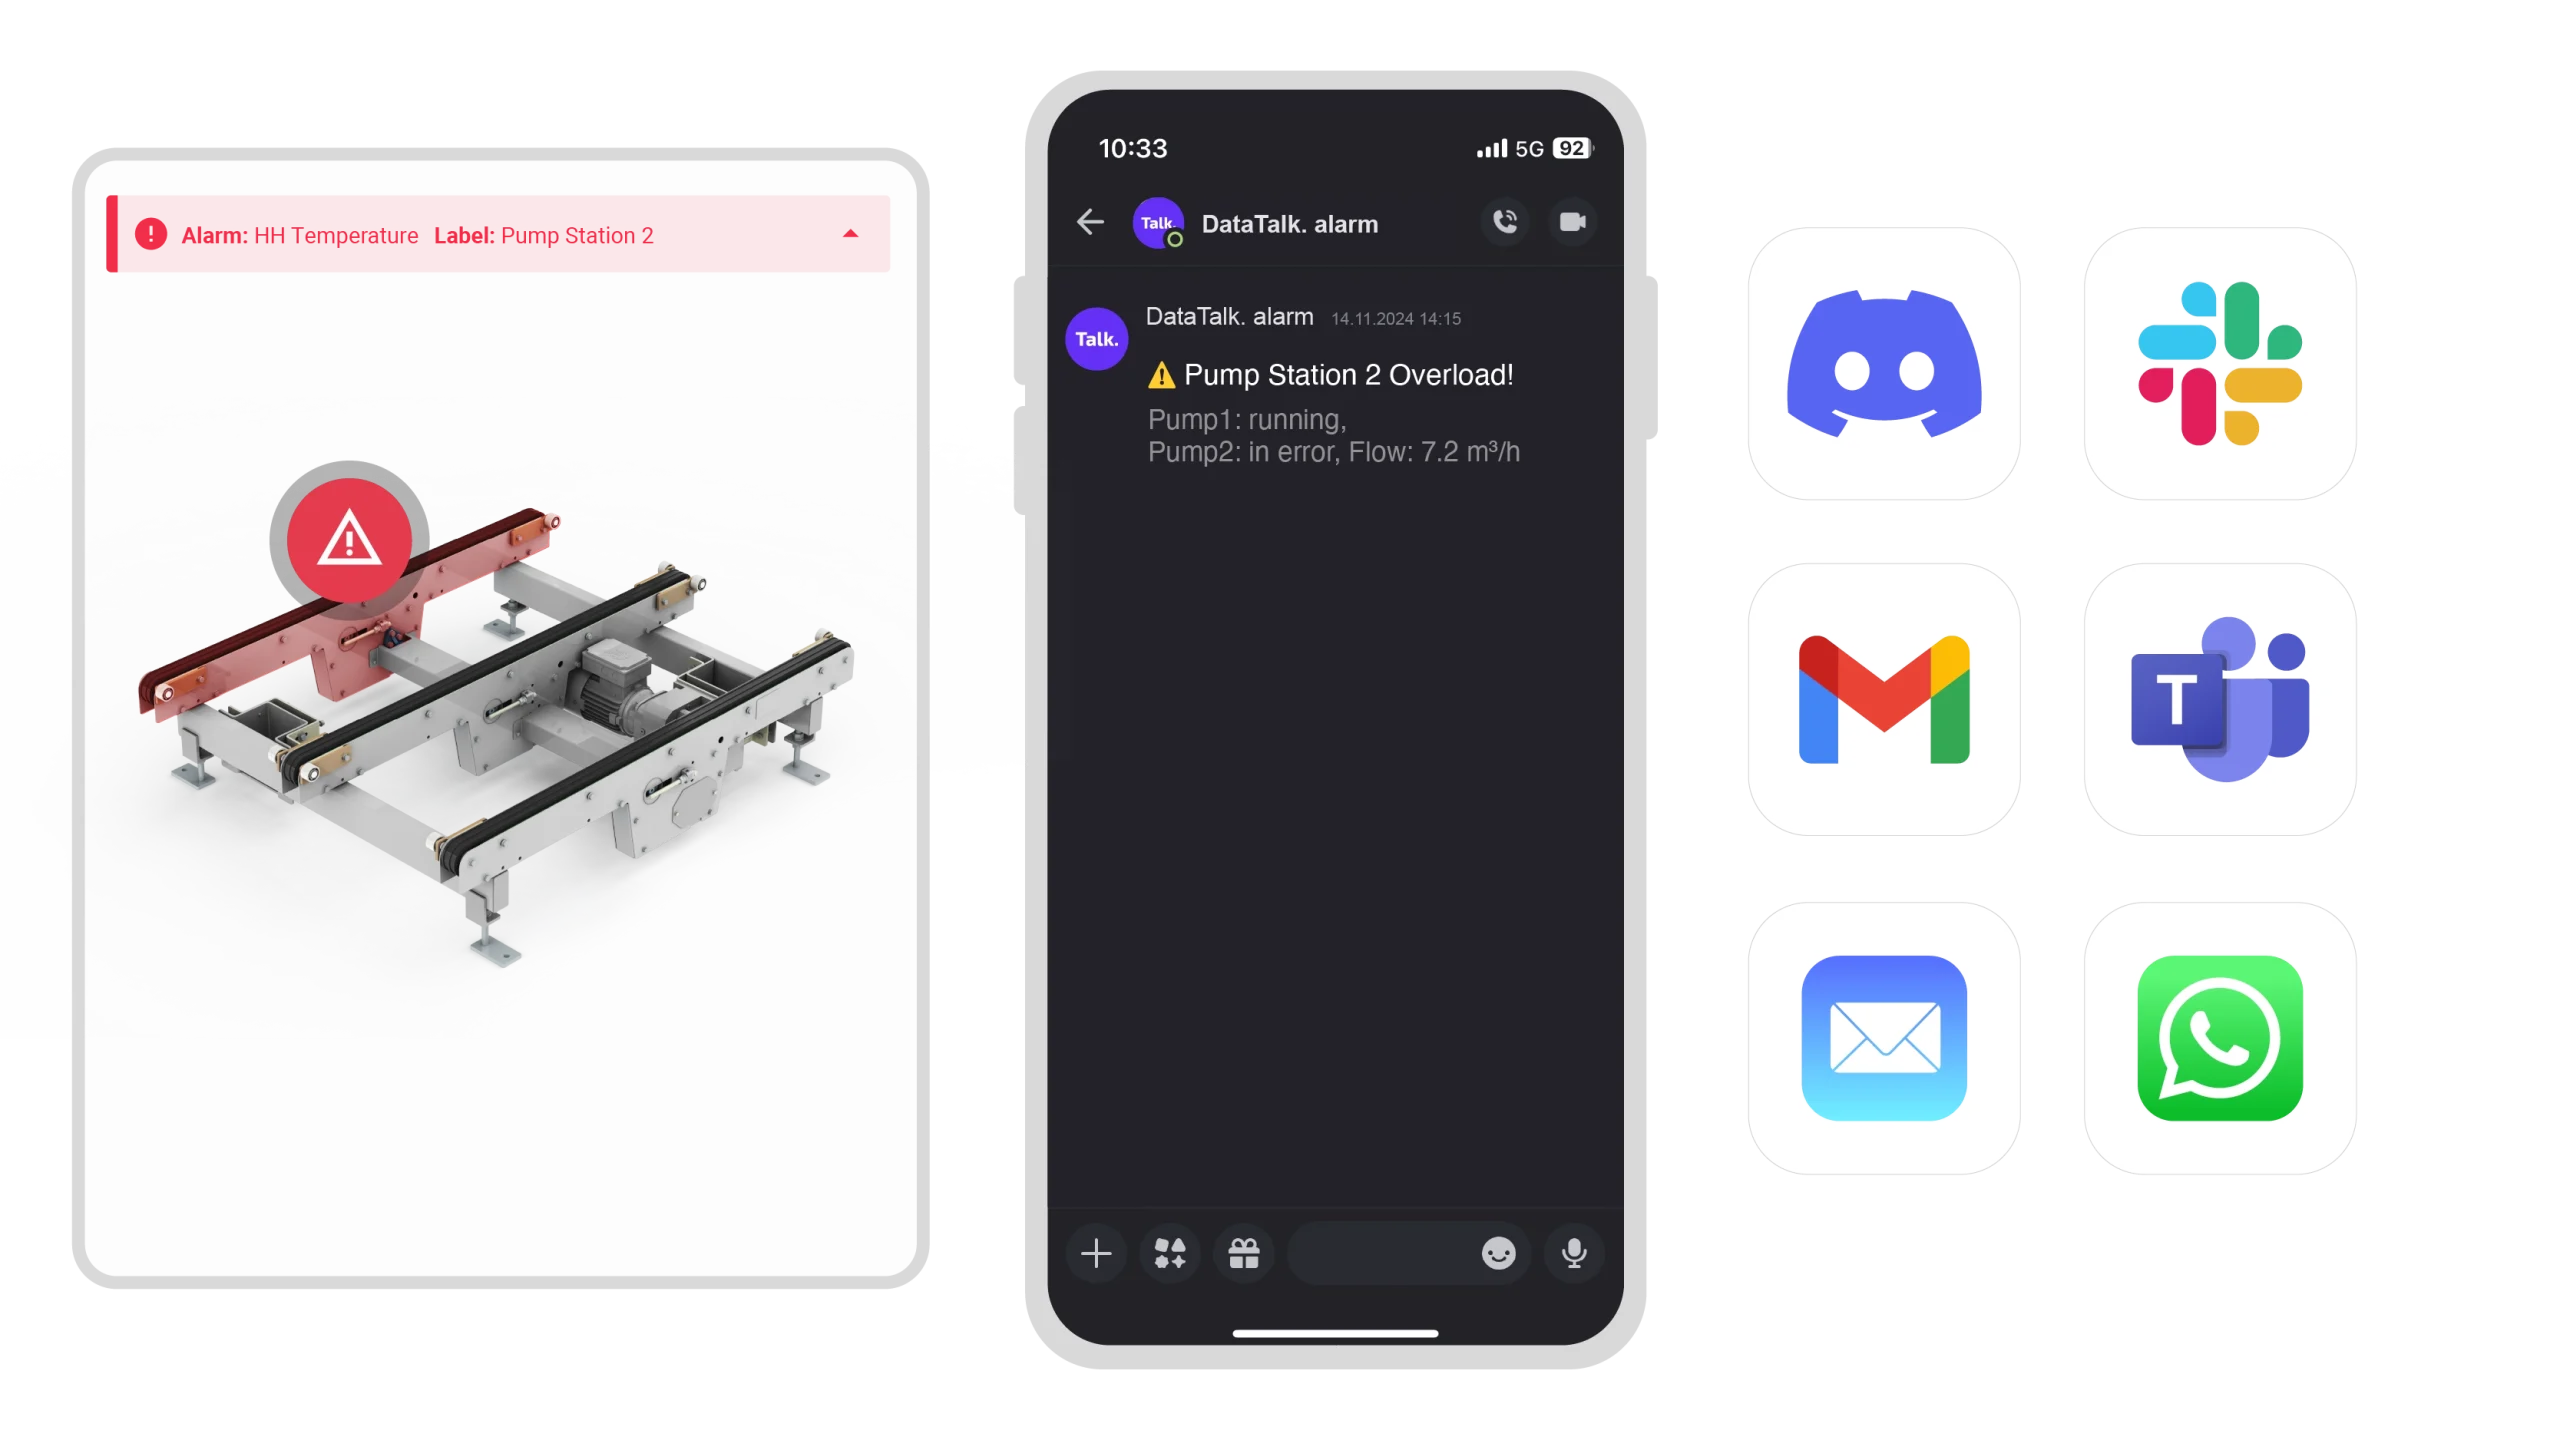
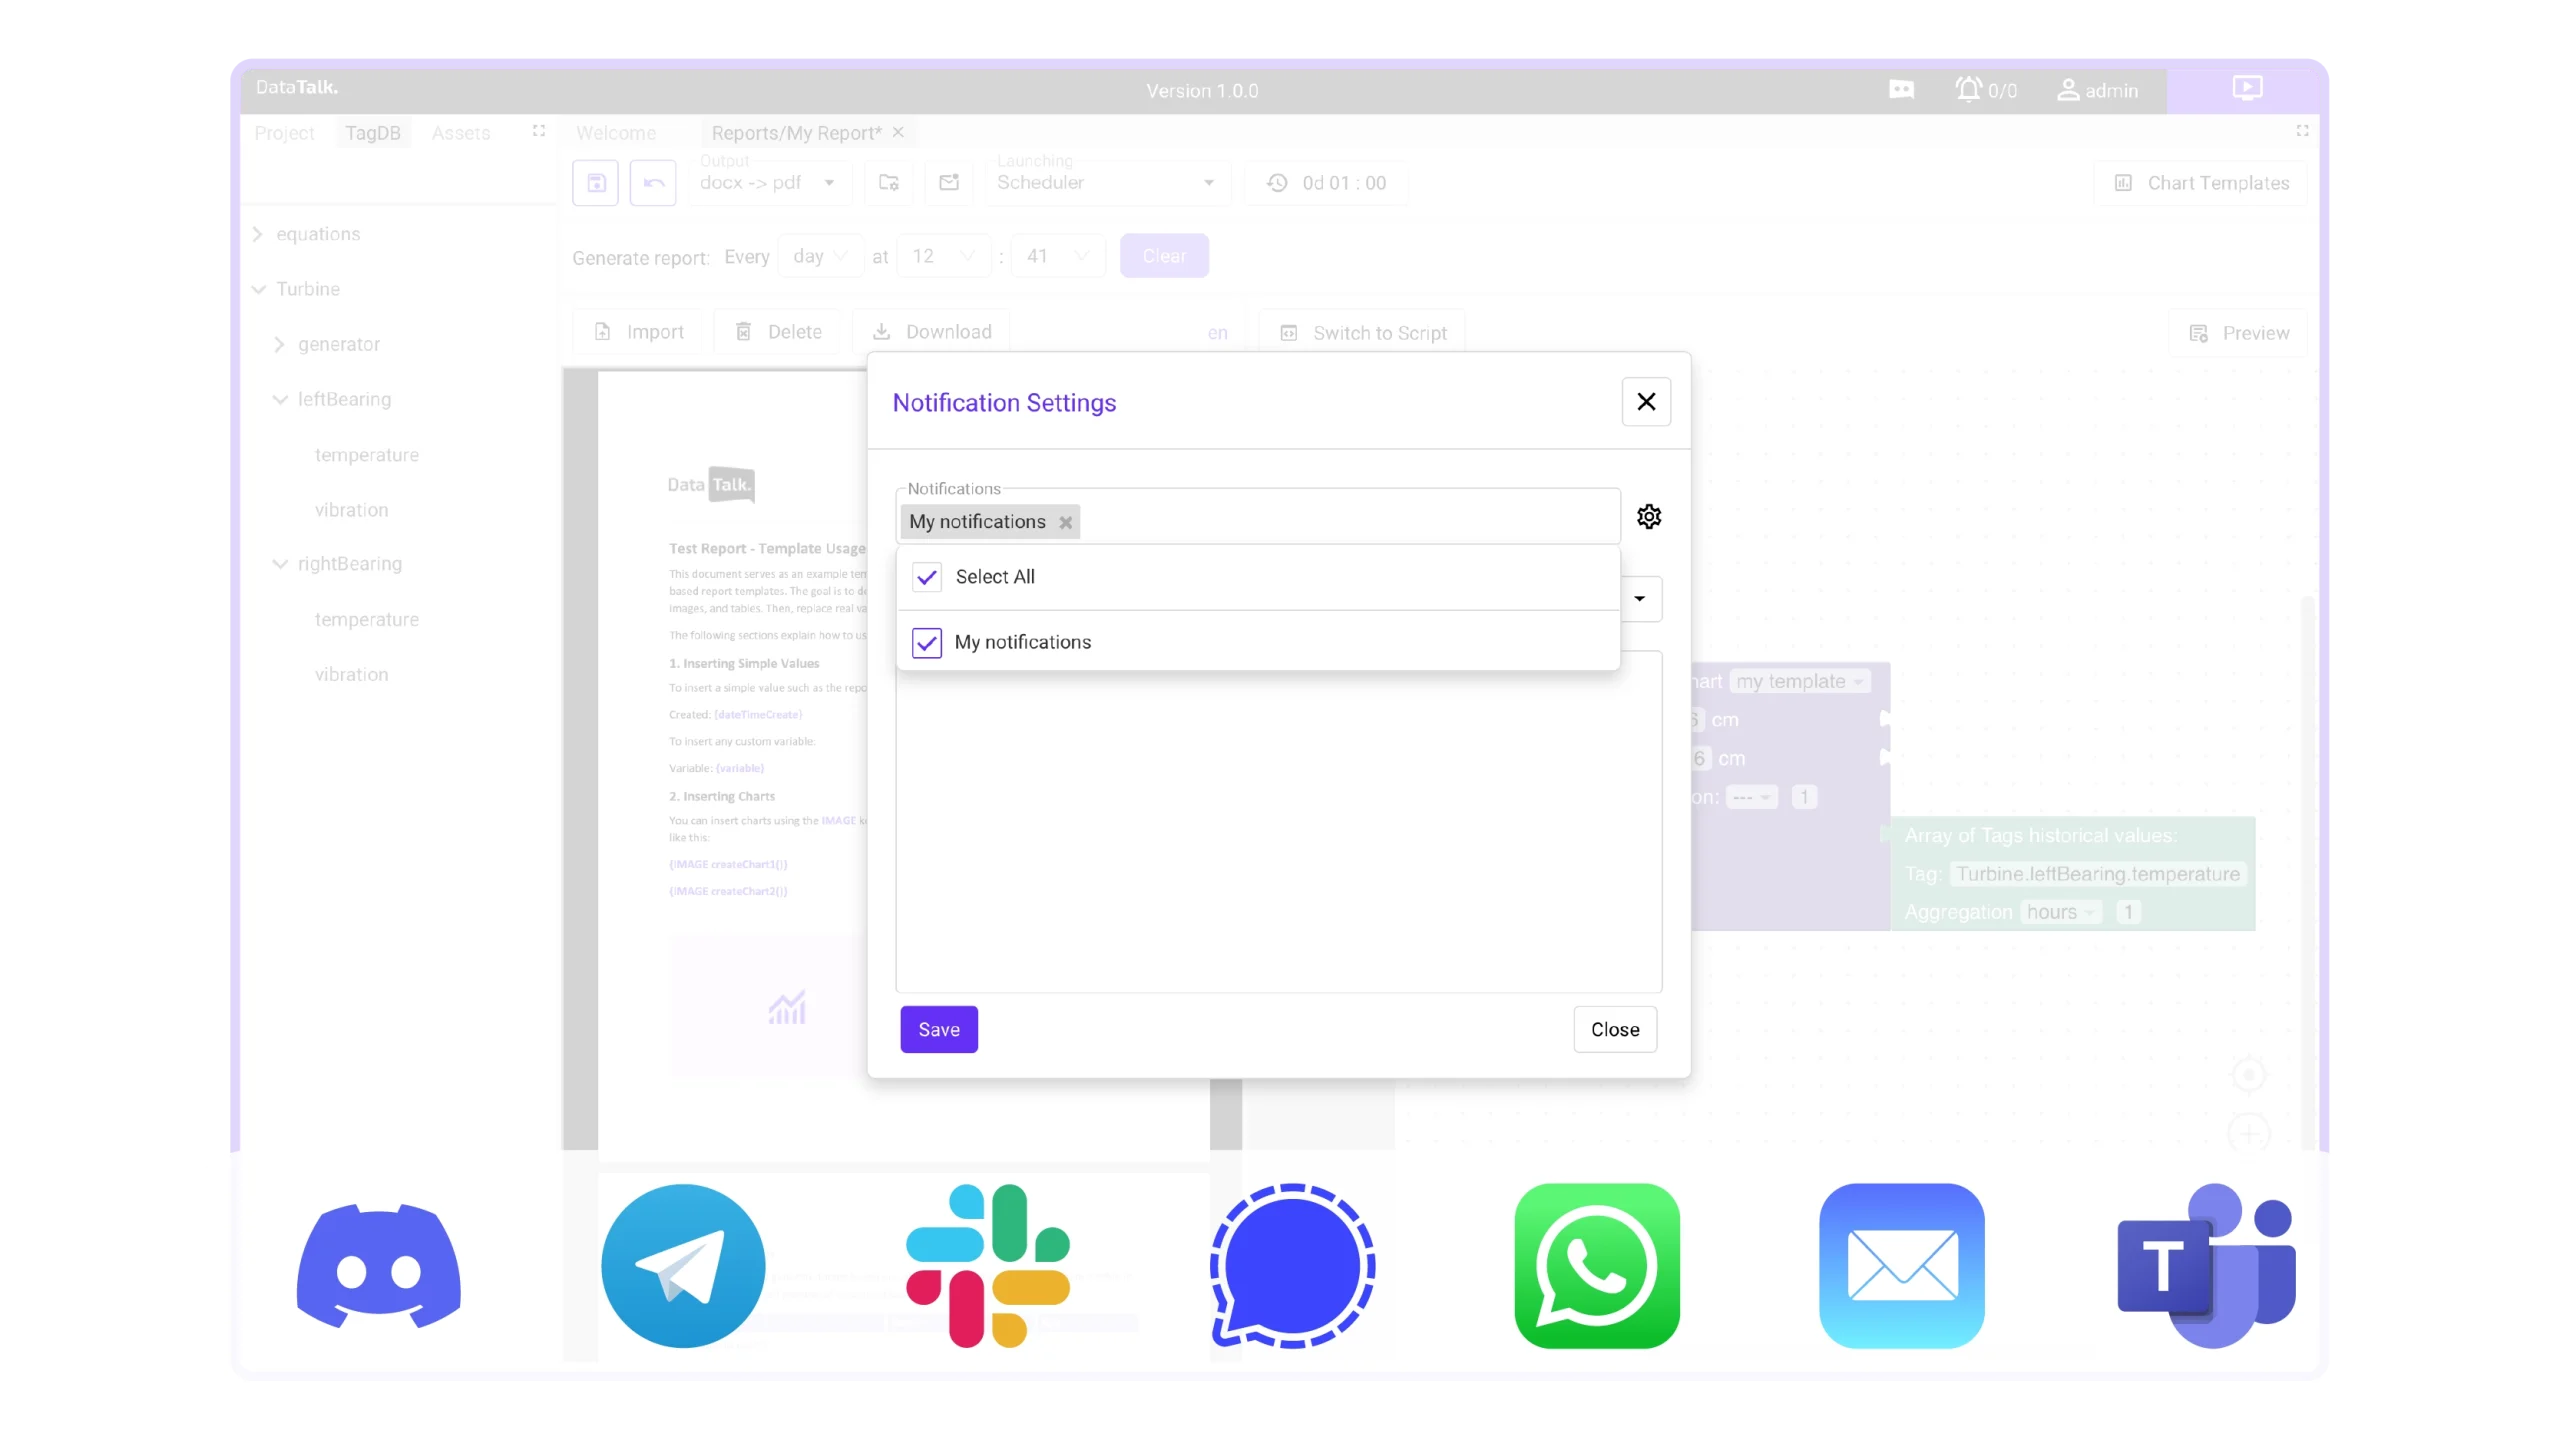
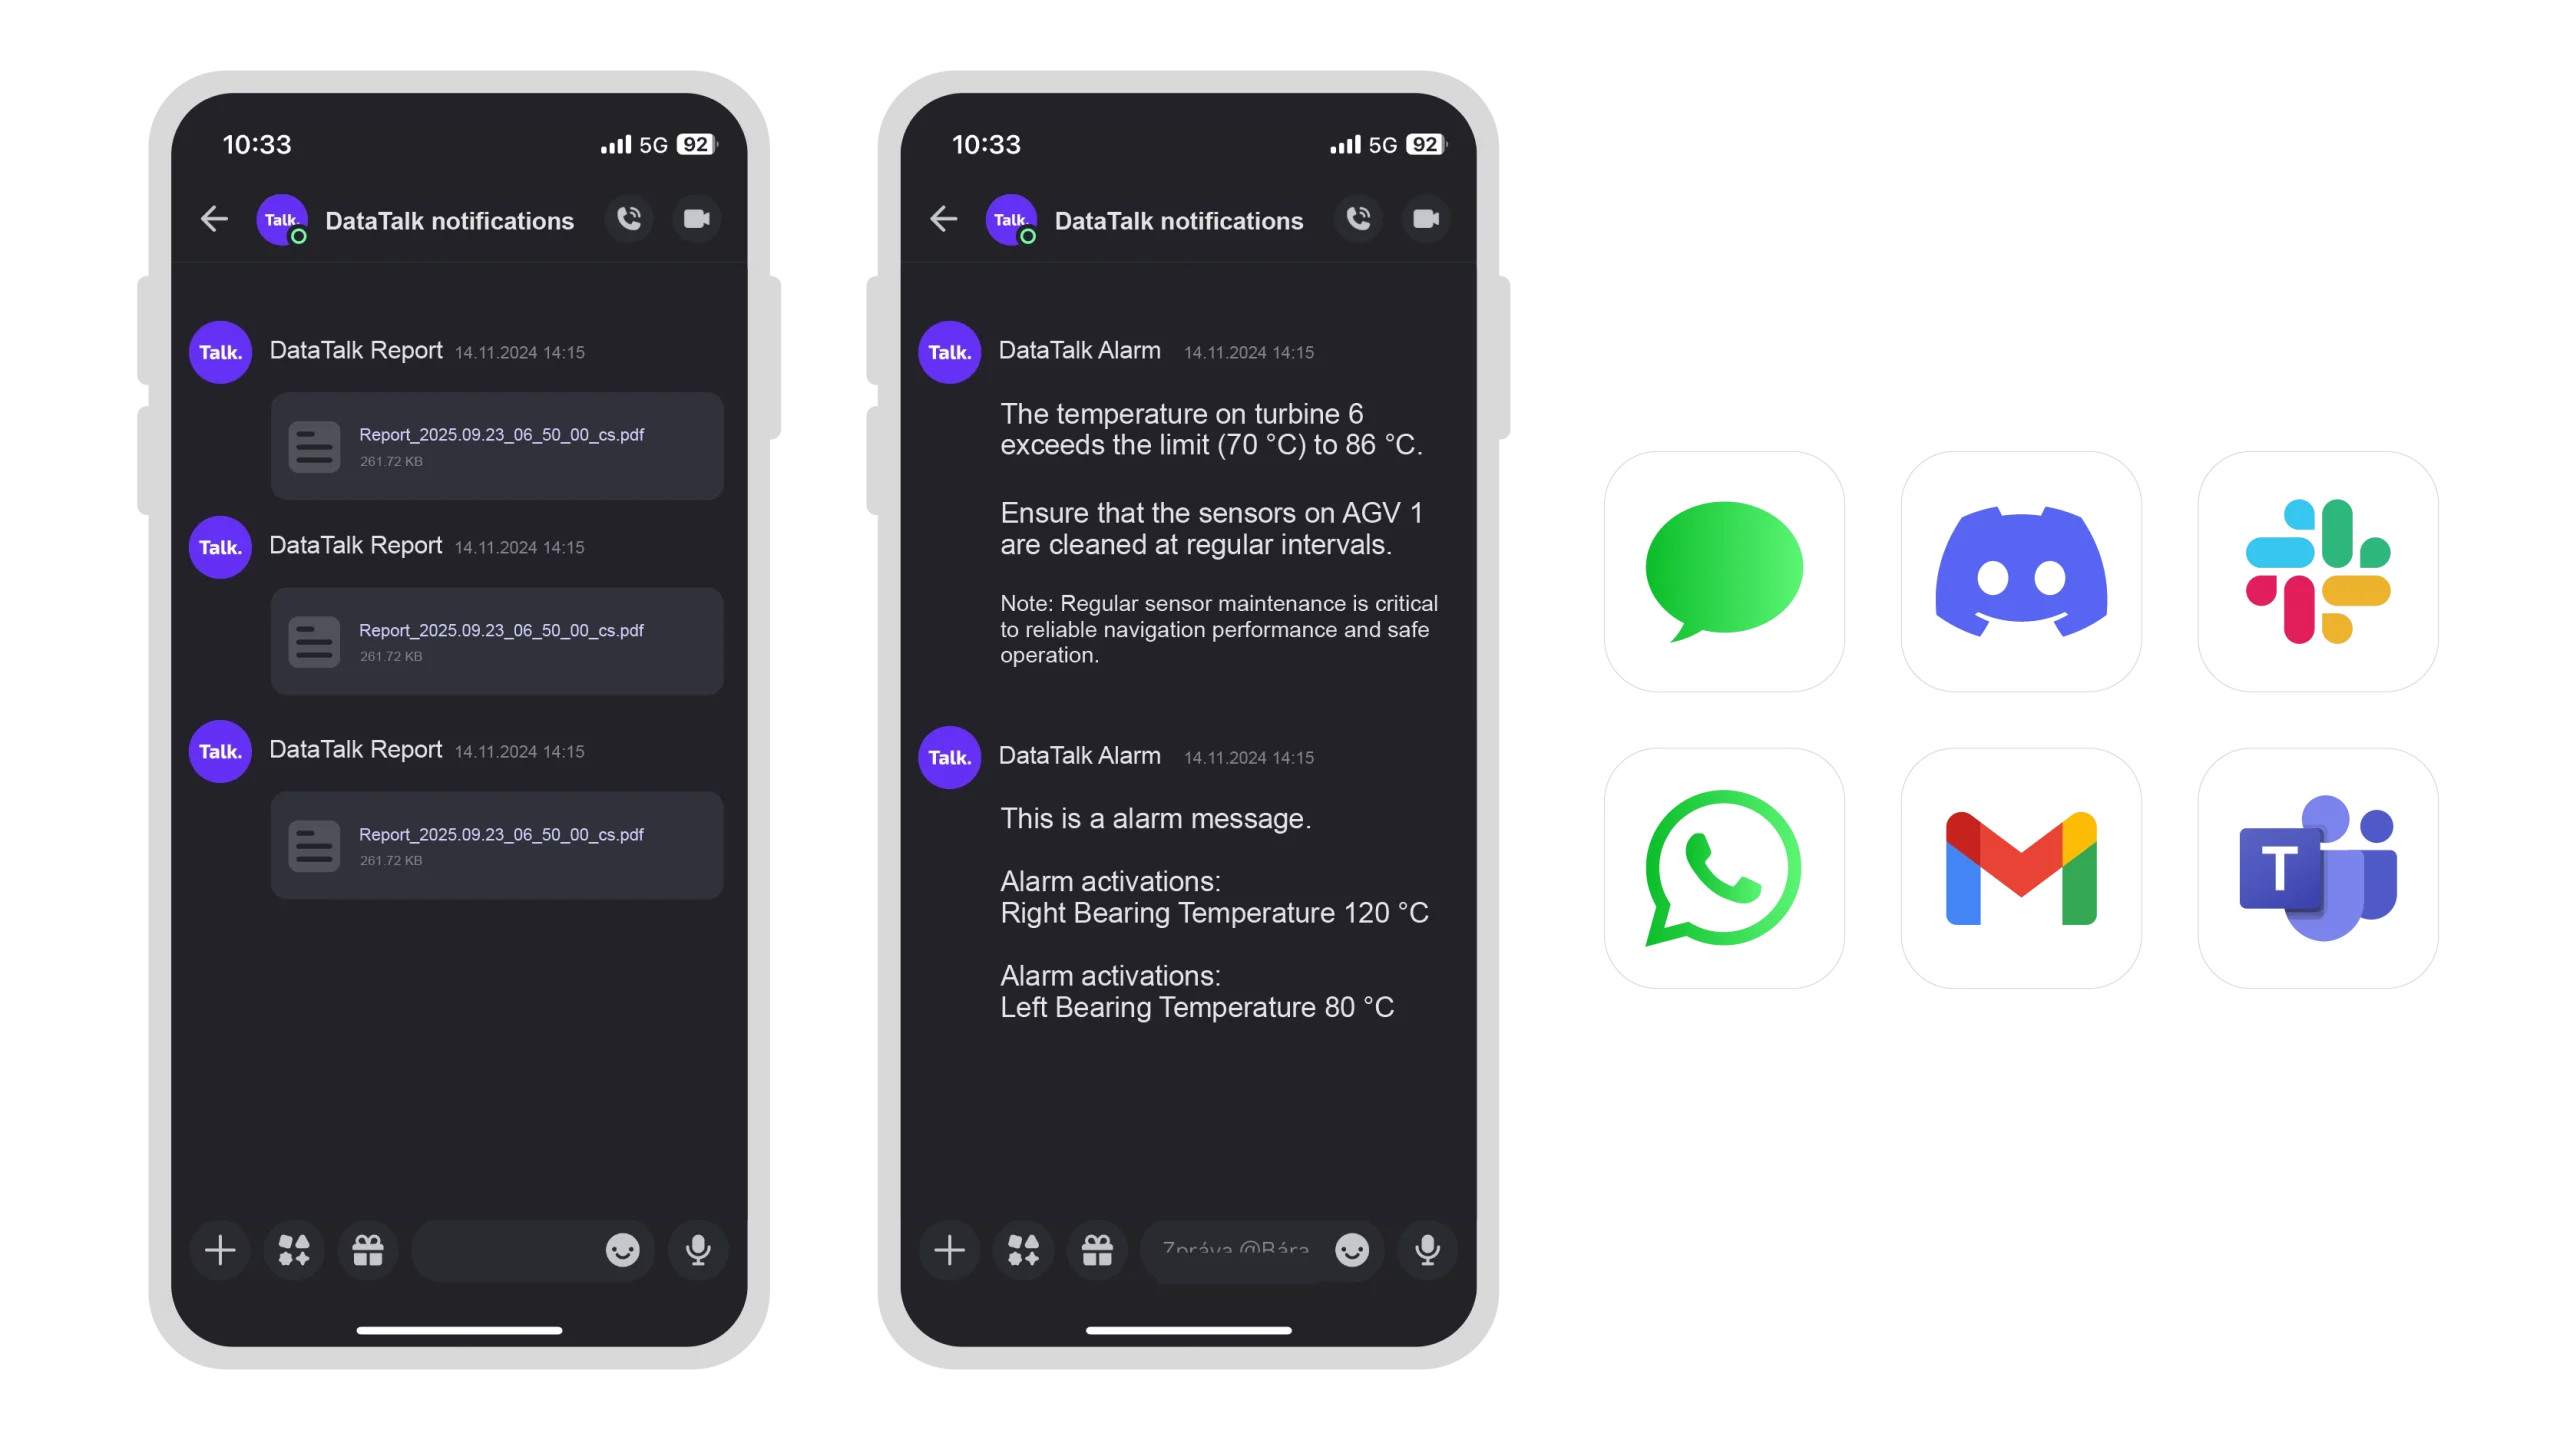
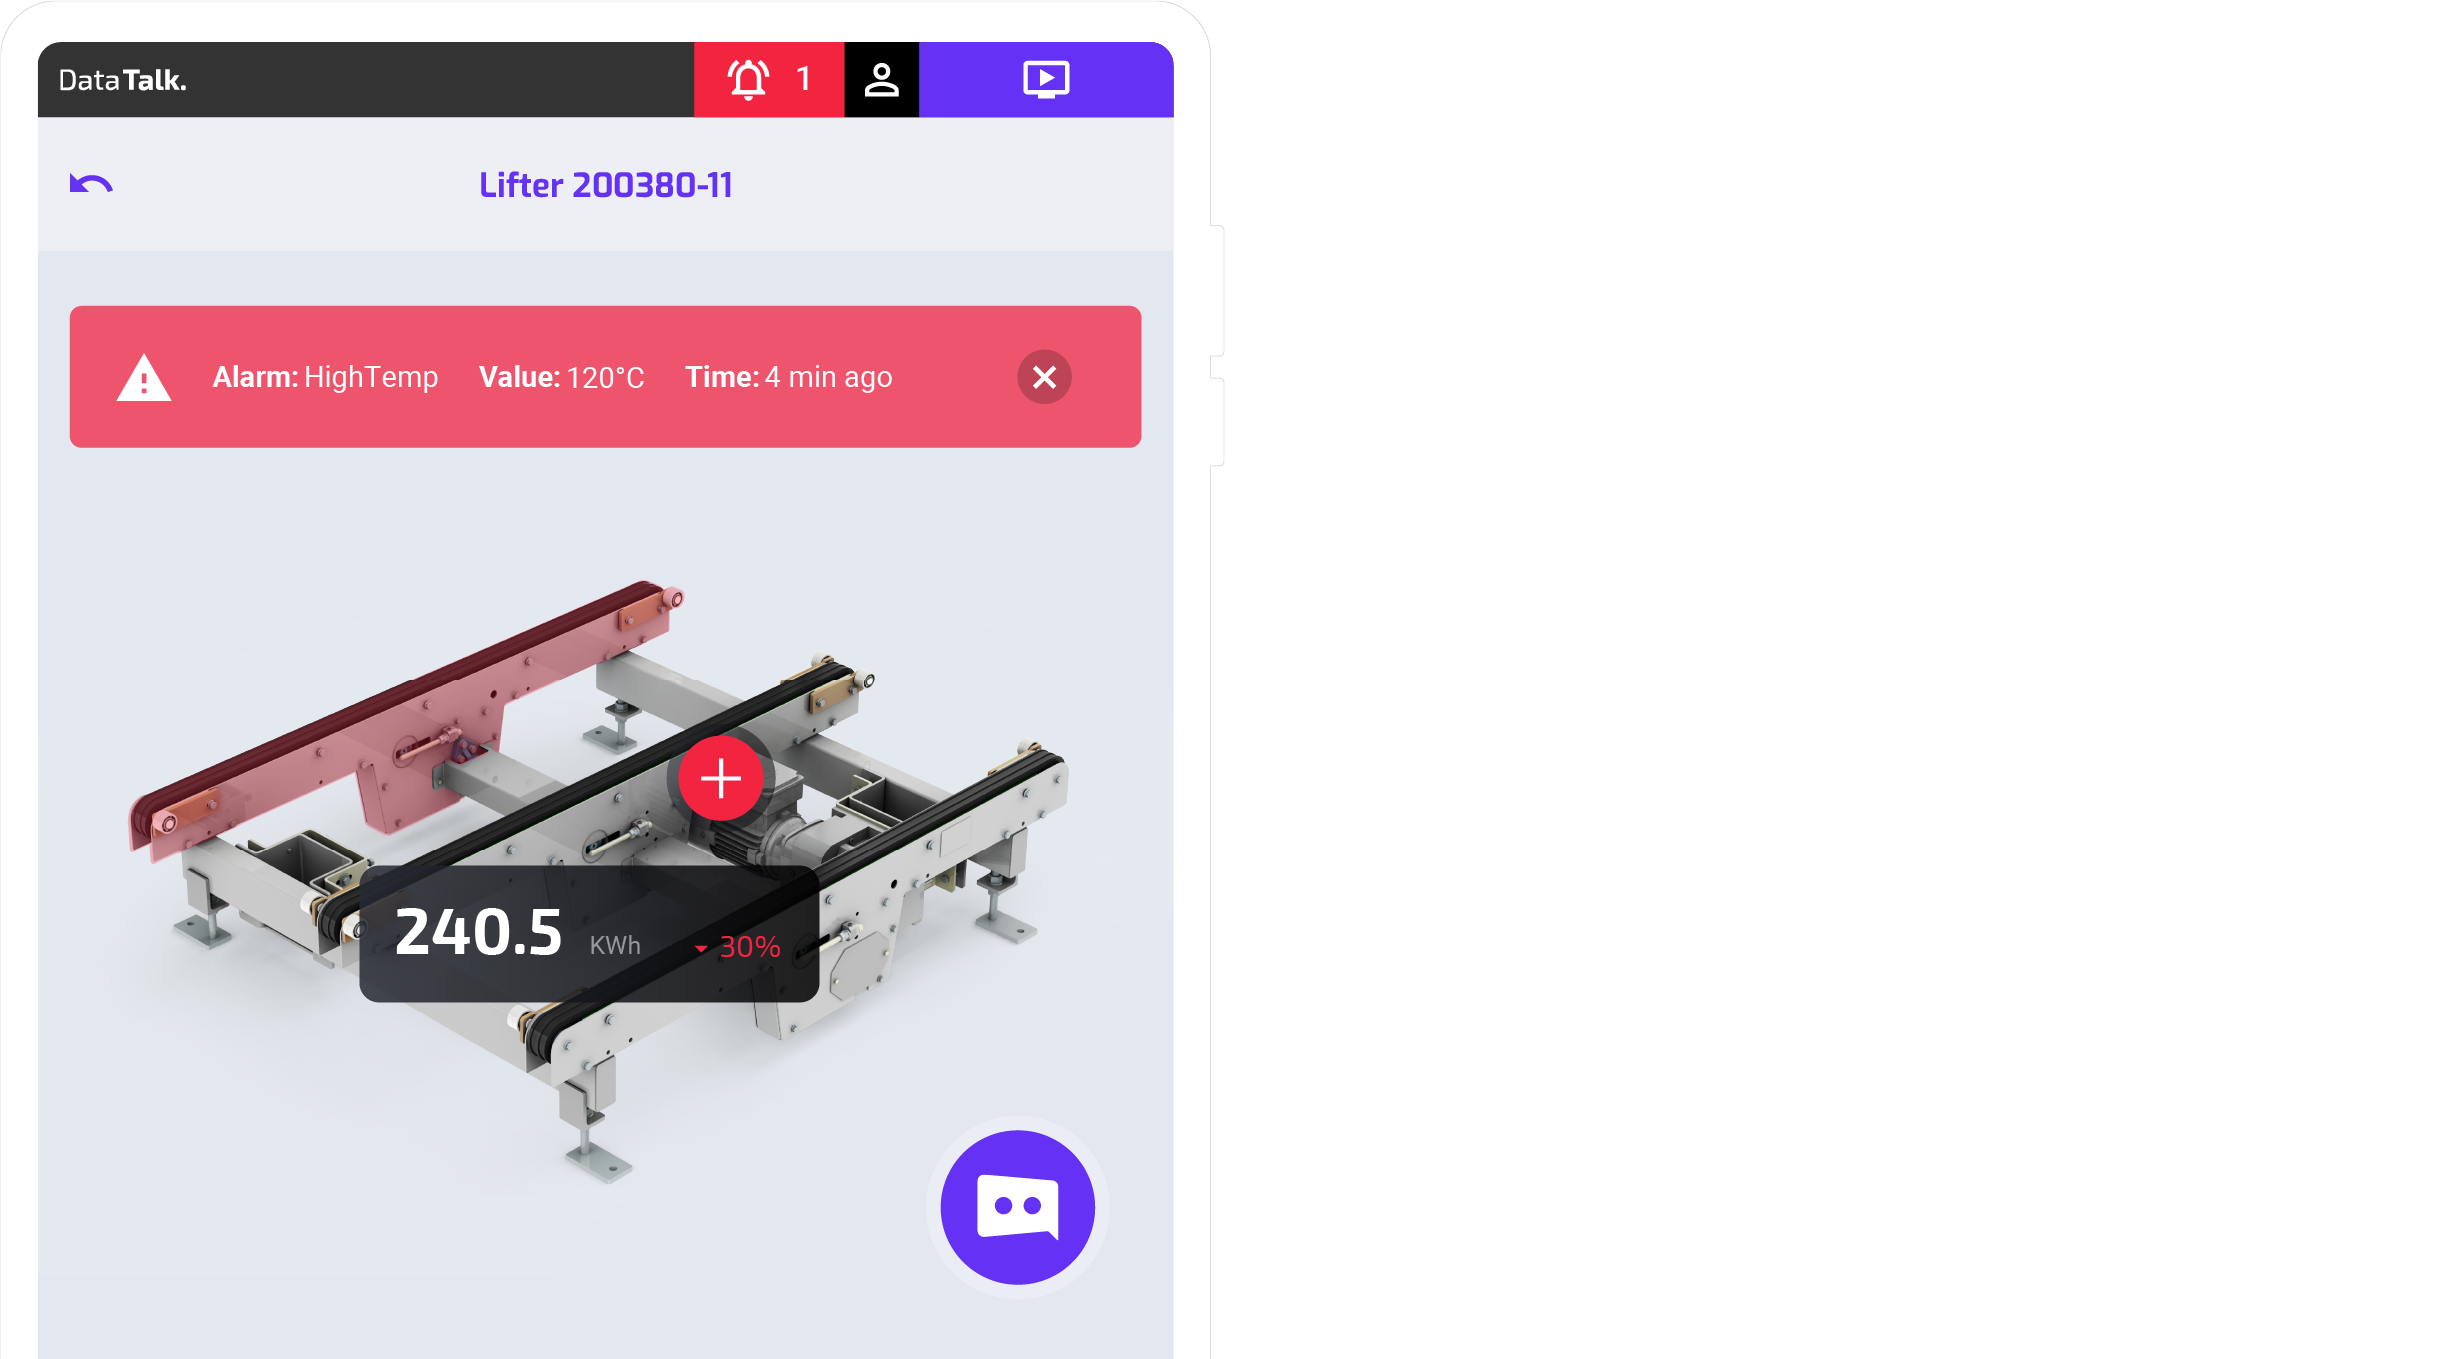
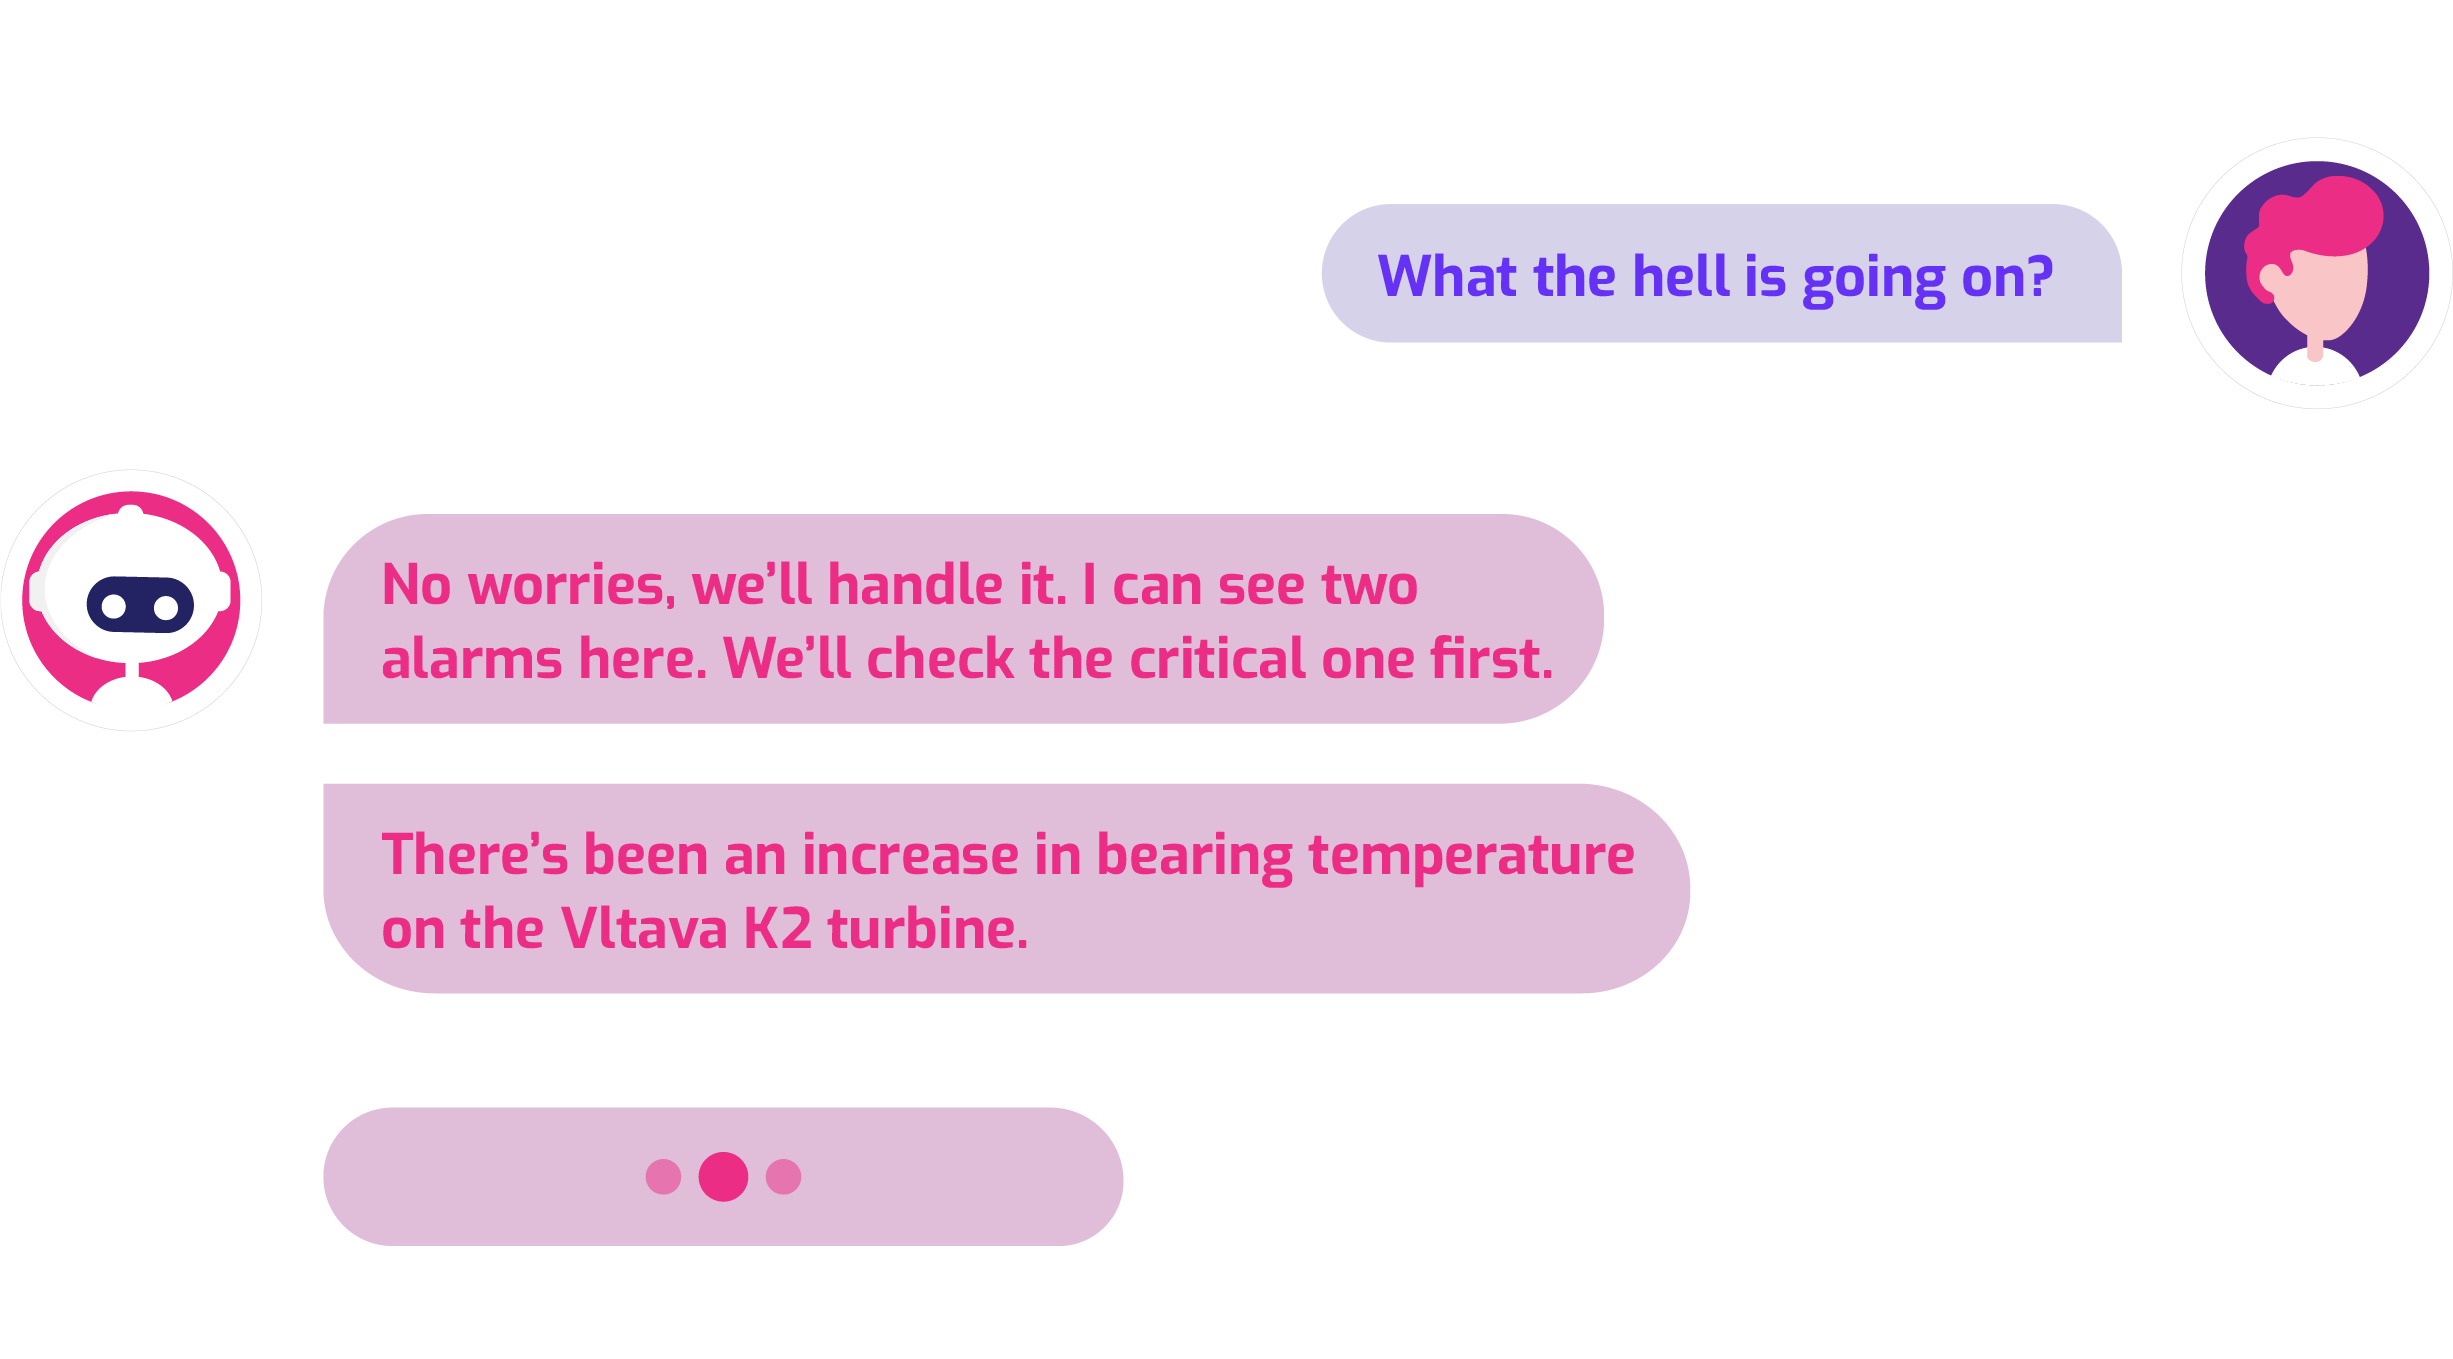
The Alarm & Notify scans your technology in real time, notifying you of irregularities via email, SMS, WhatsApp, Discord and more. Chat with your system (via AI), asking about current status, issues, and solutions.
AI SCADA
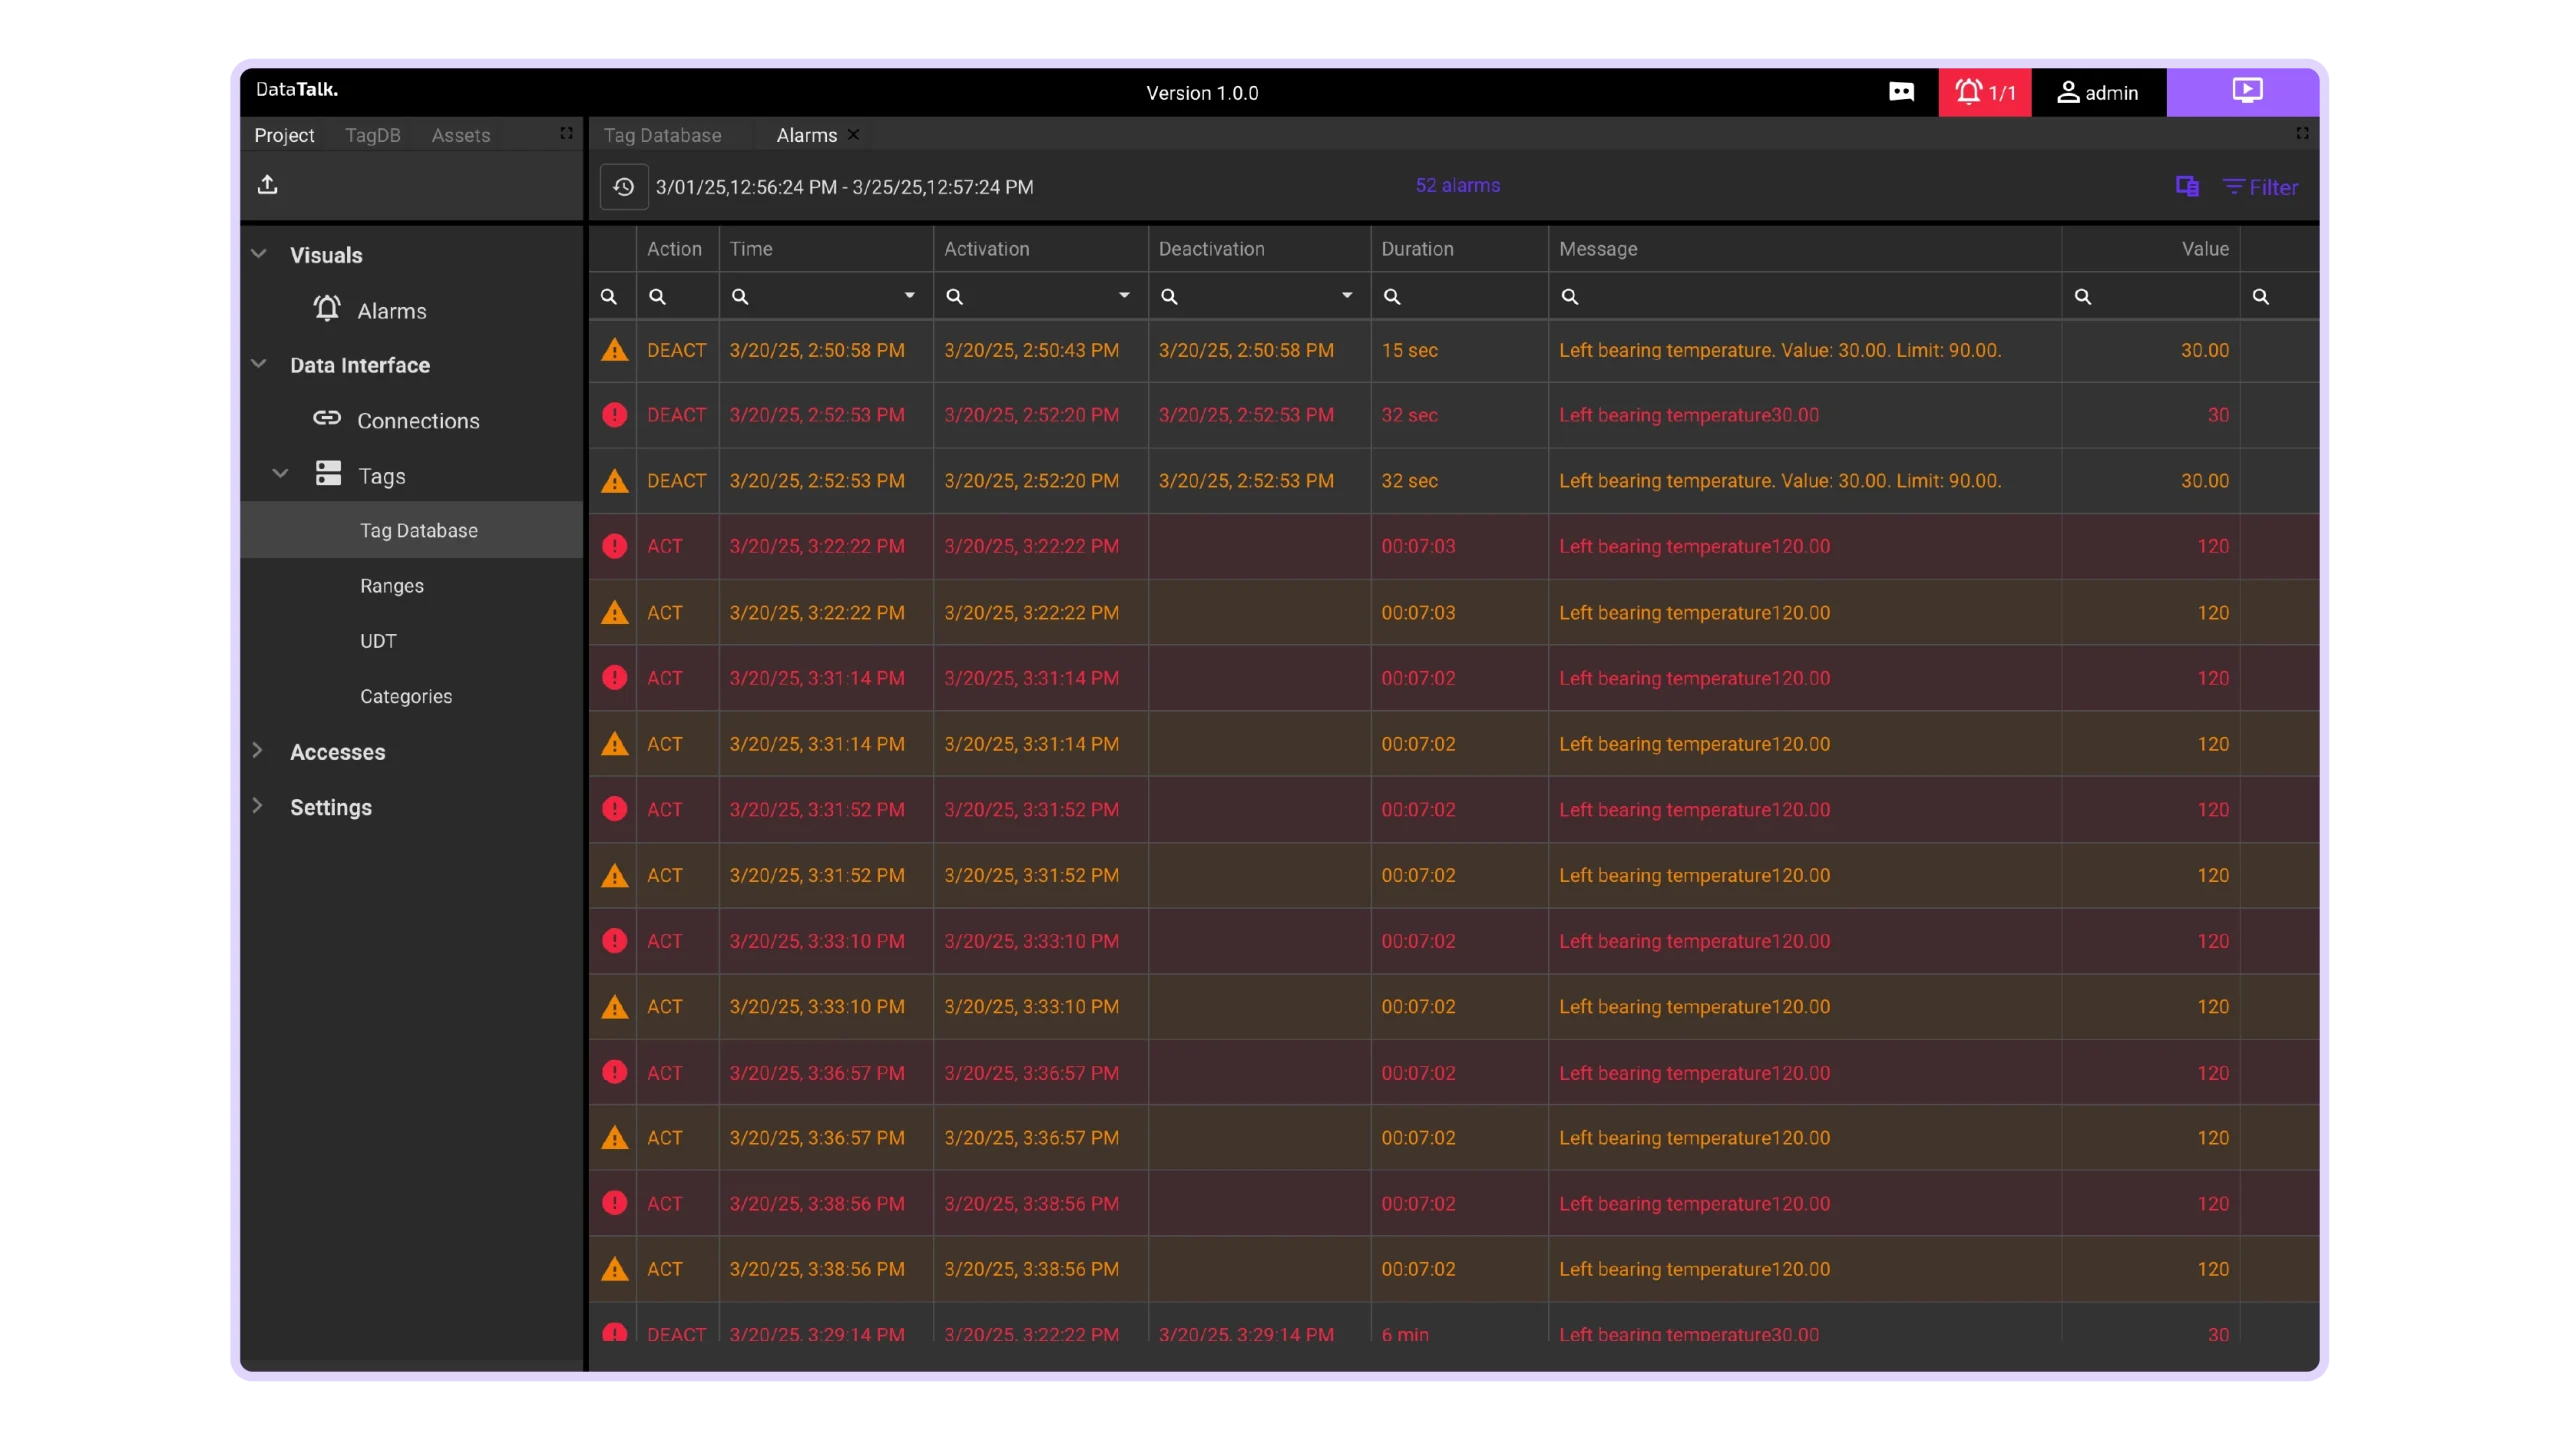
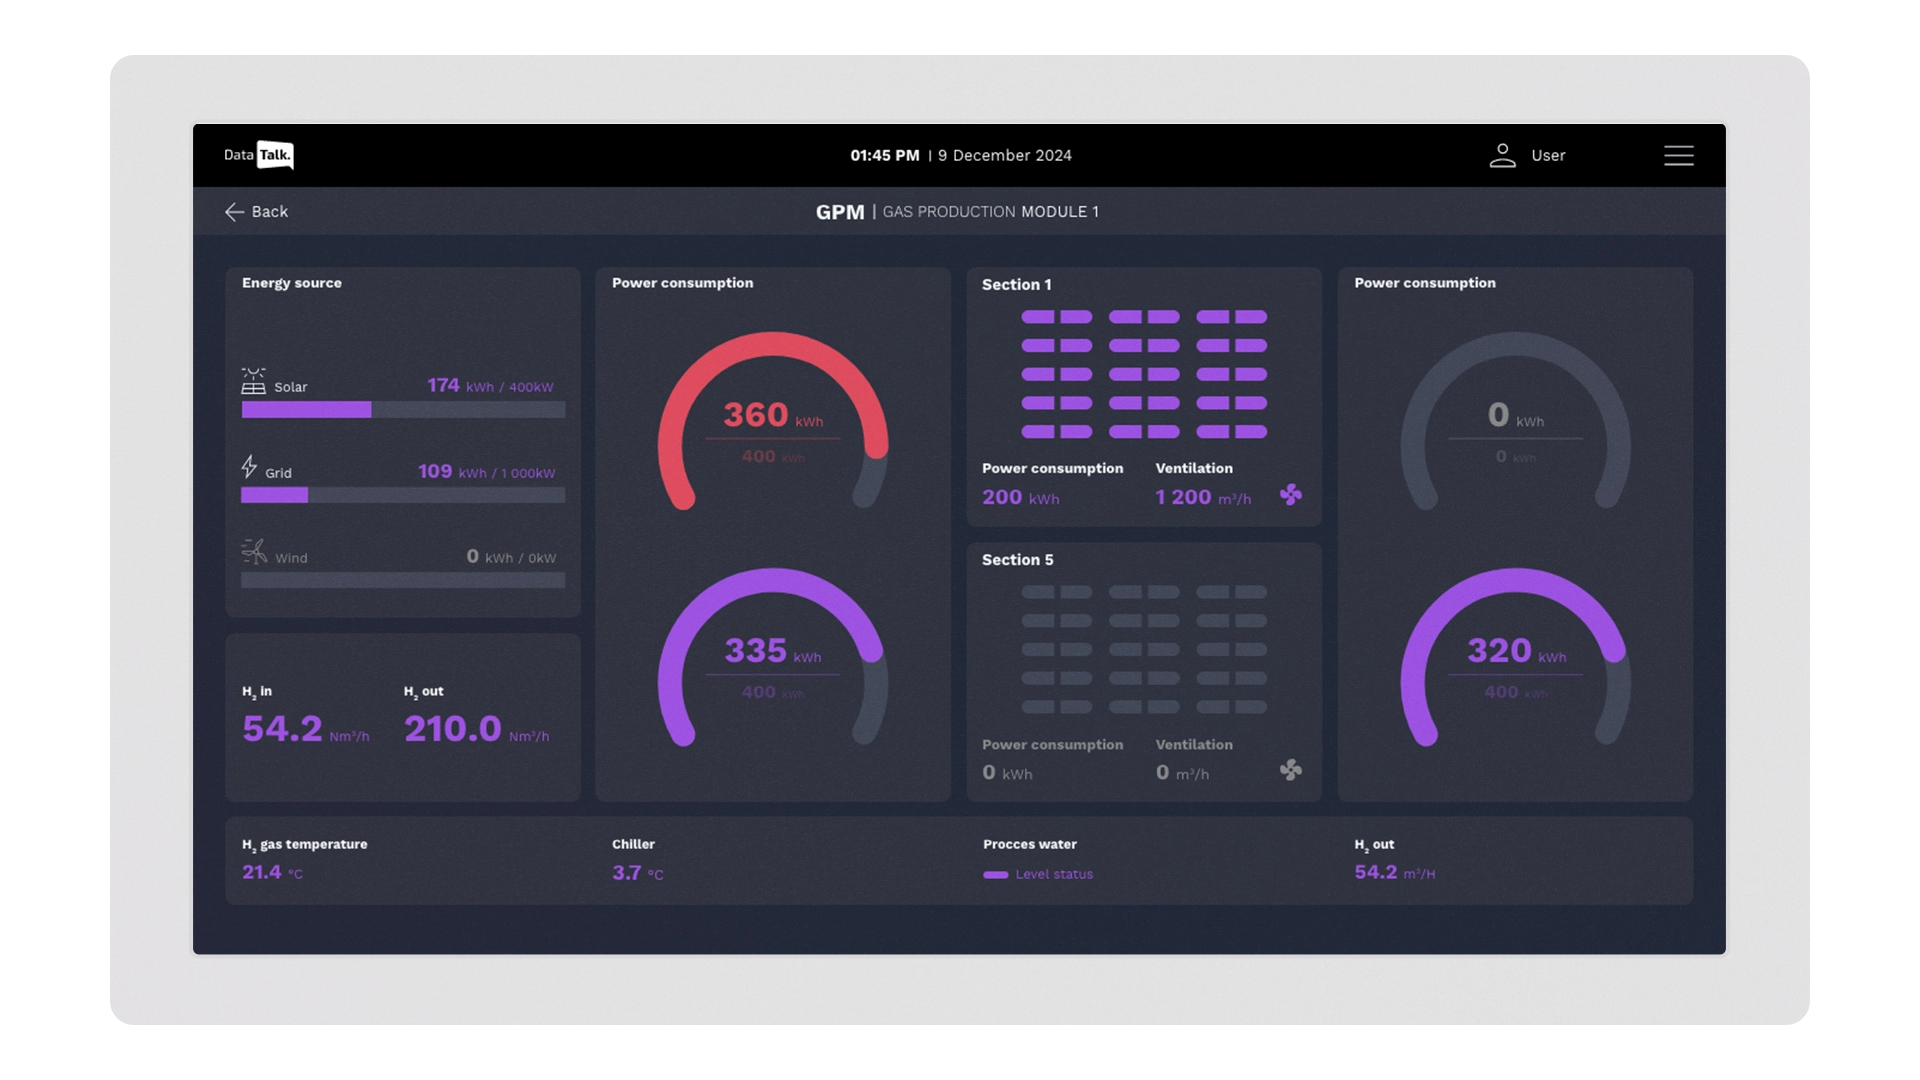
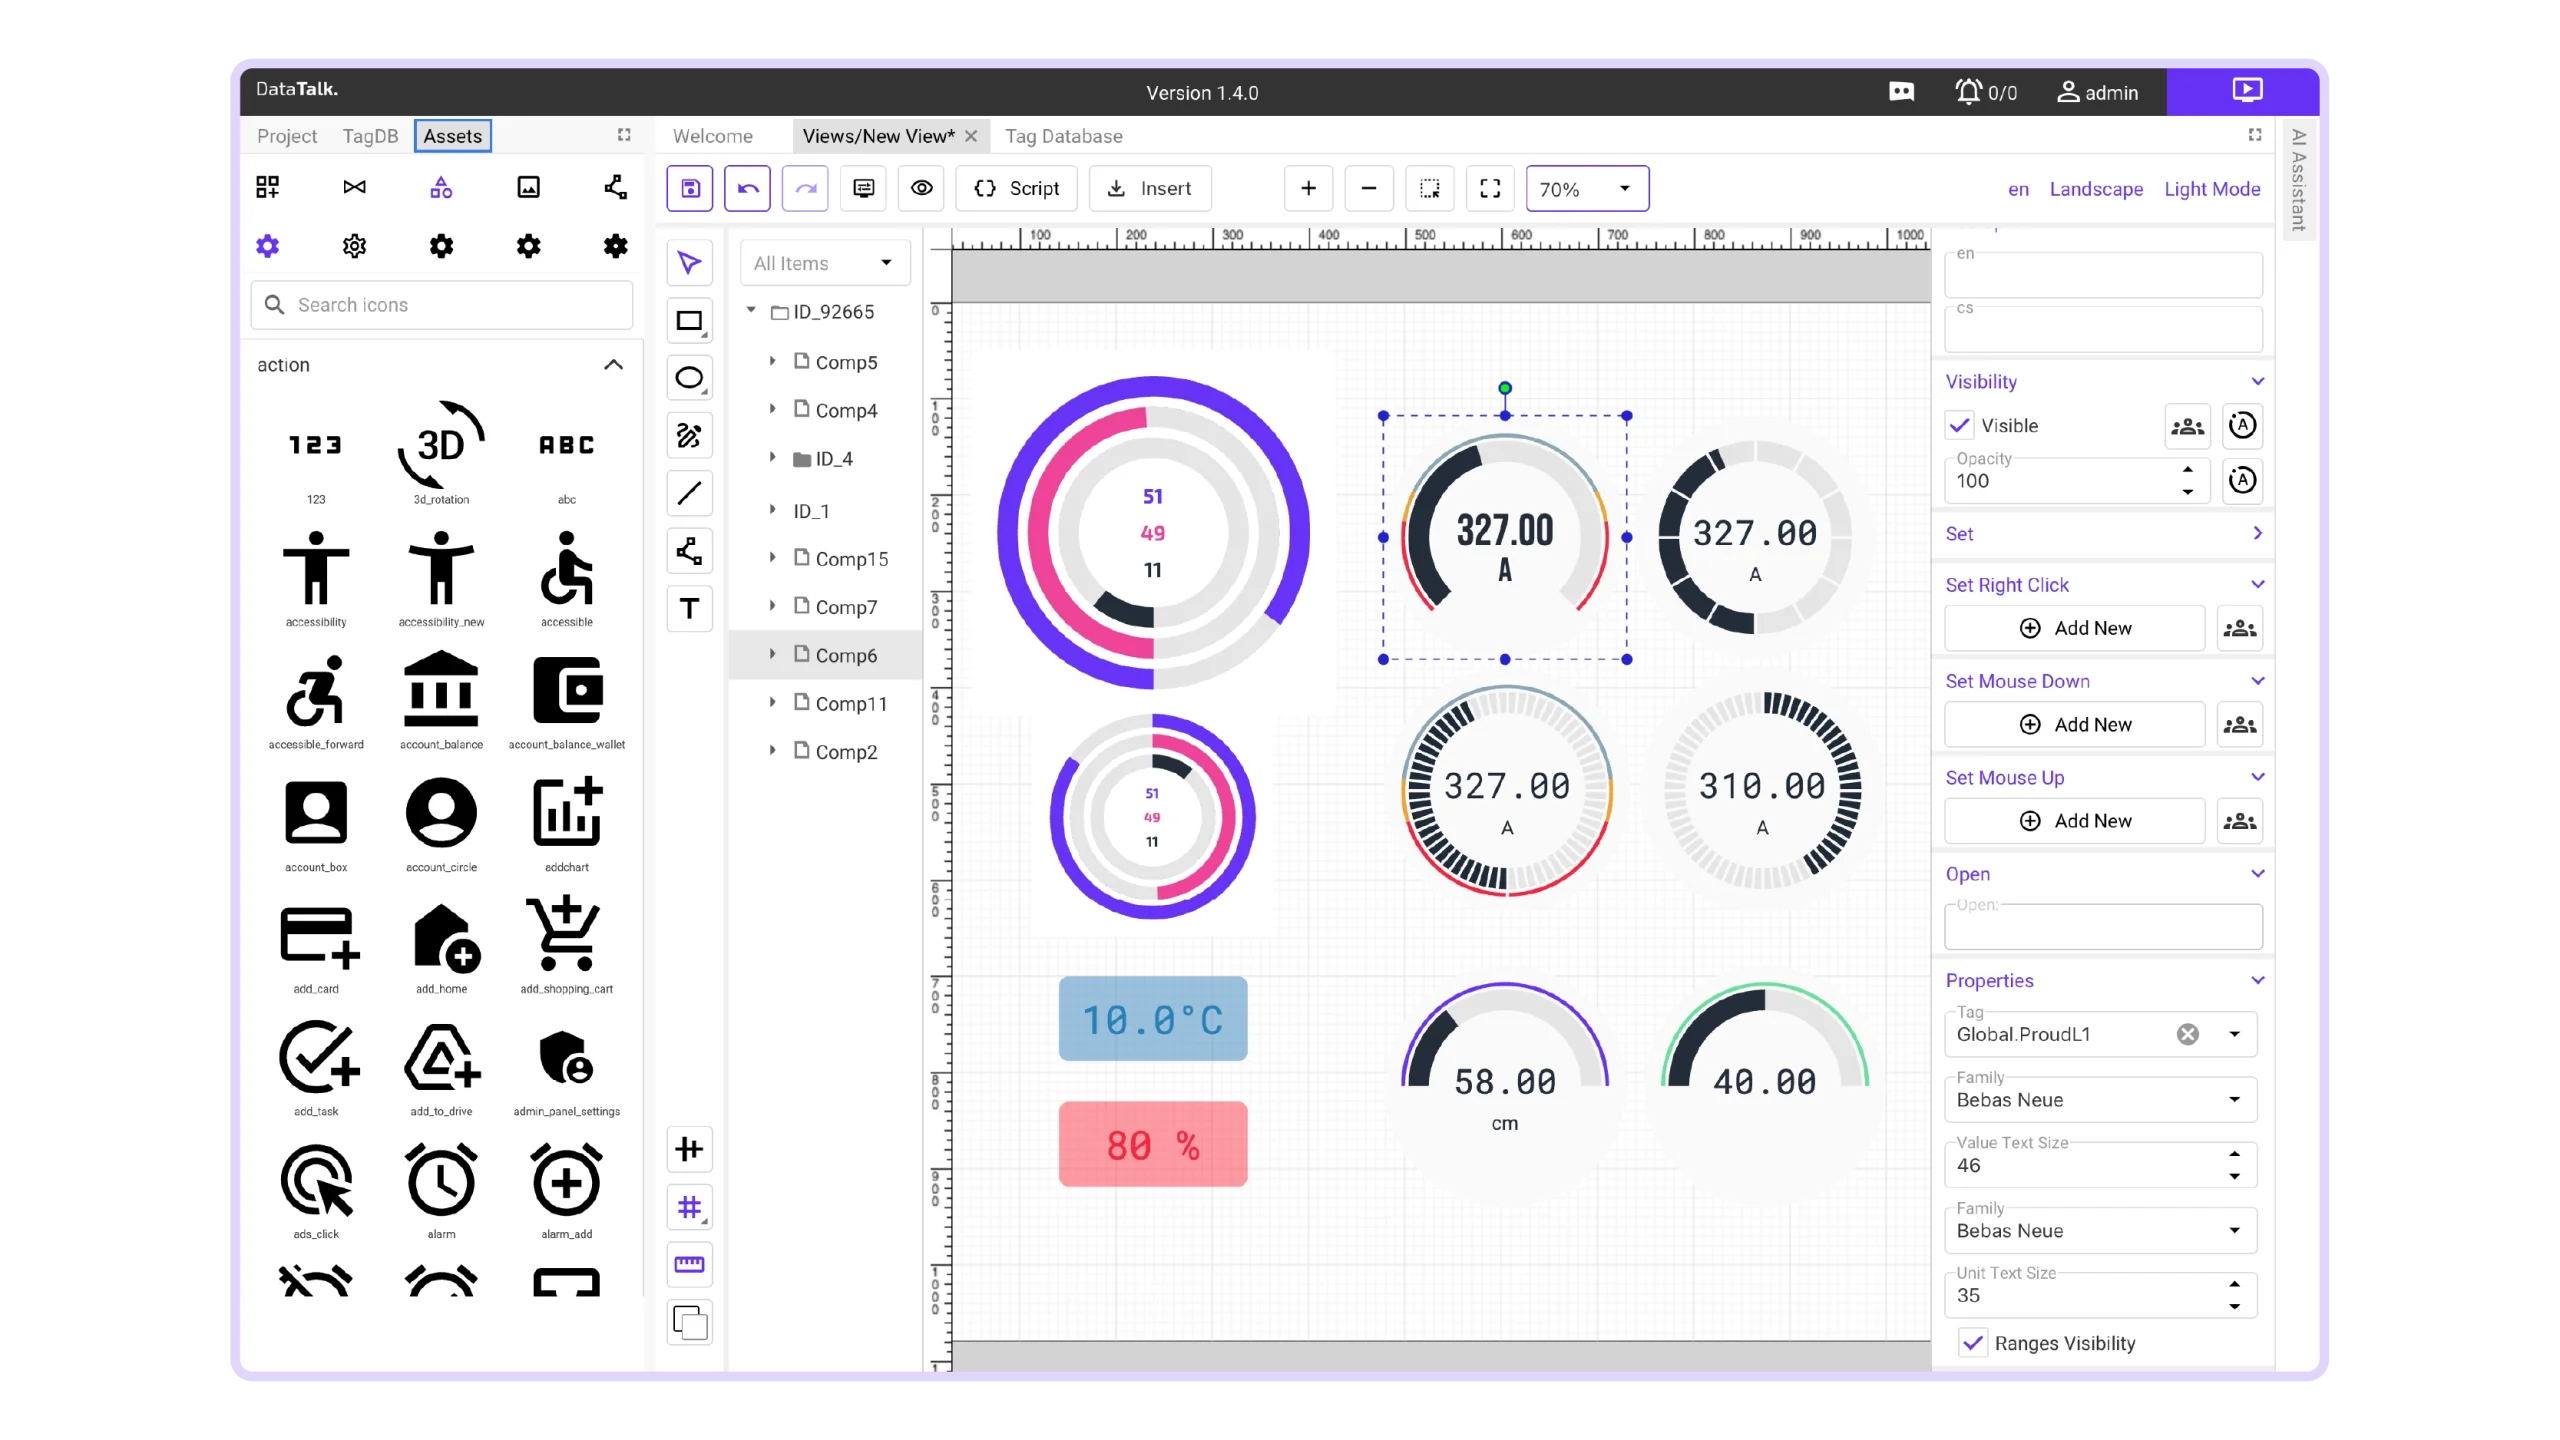
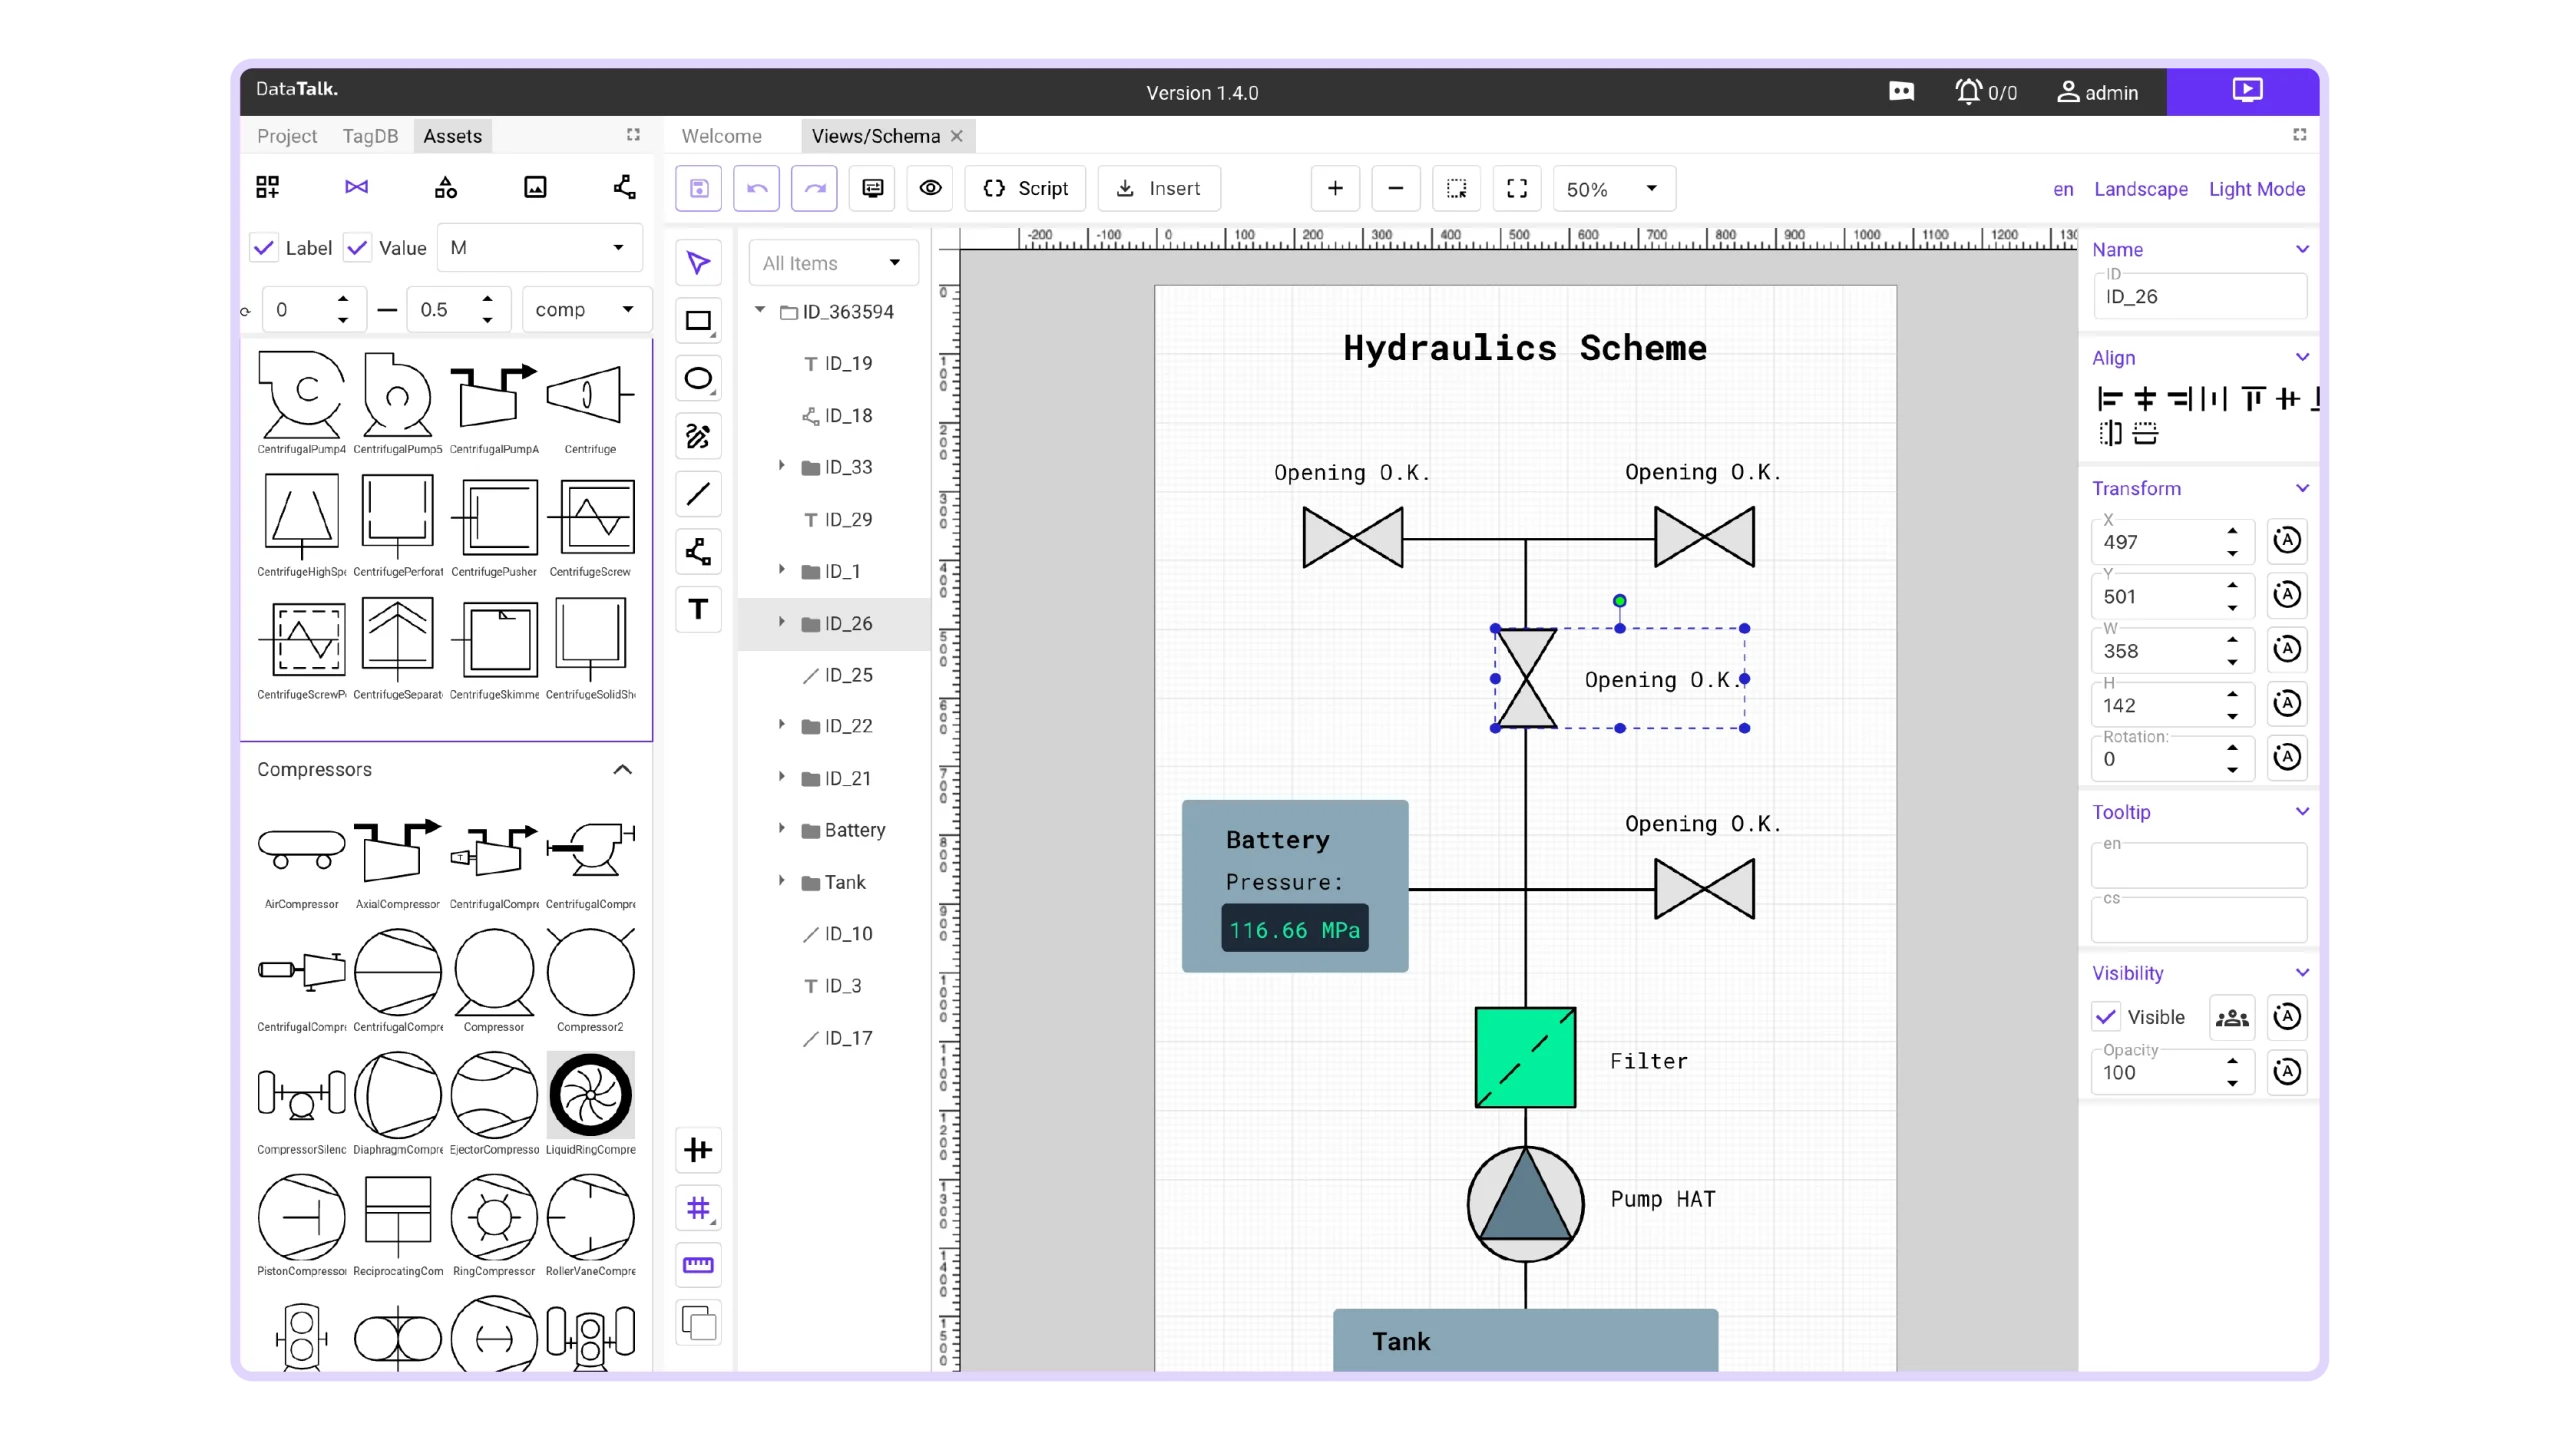
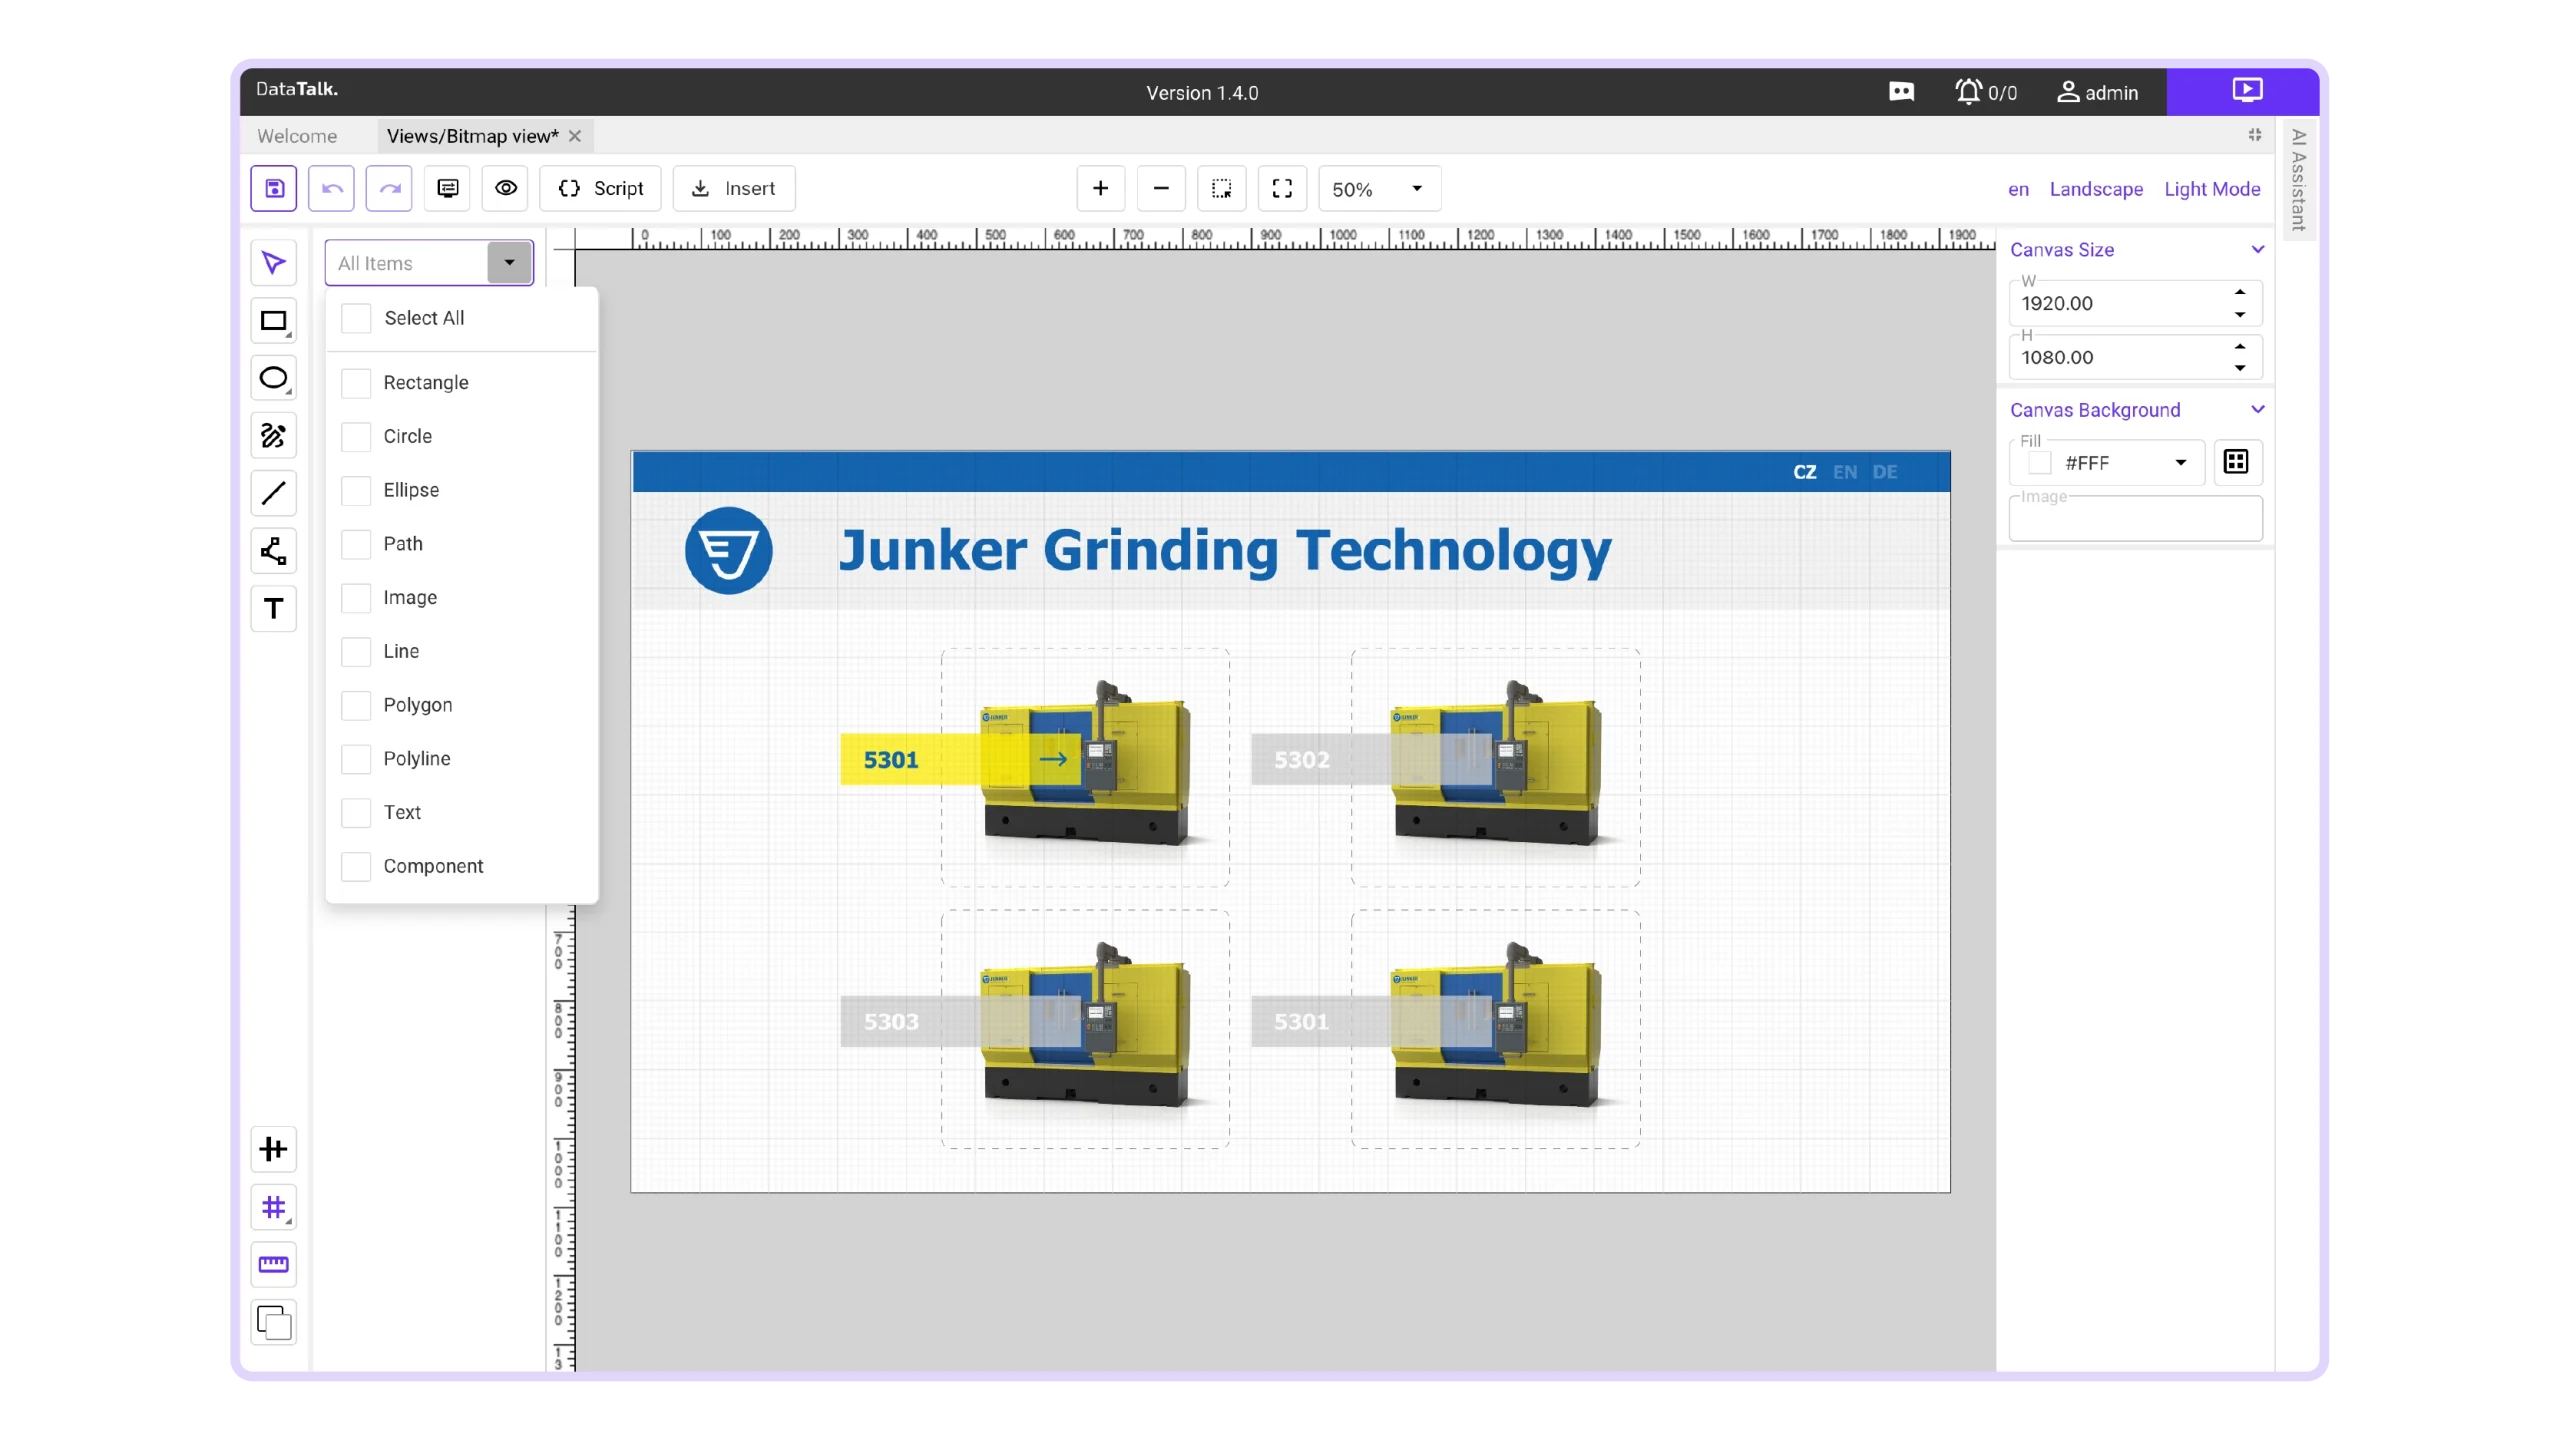
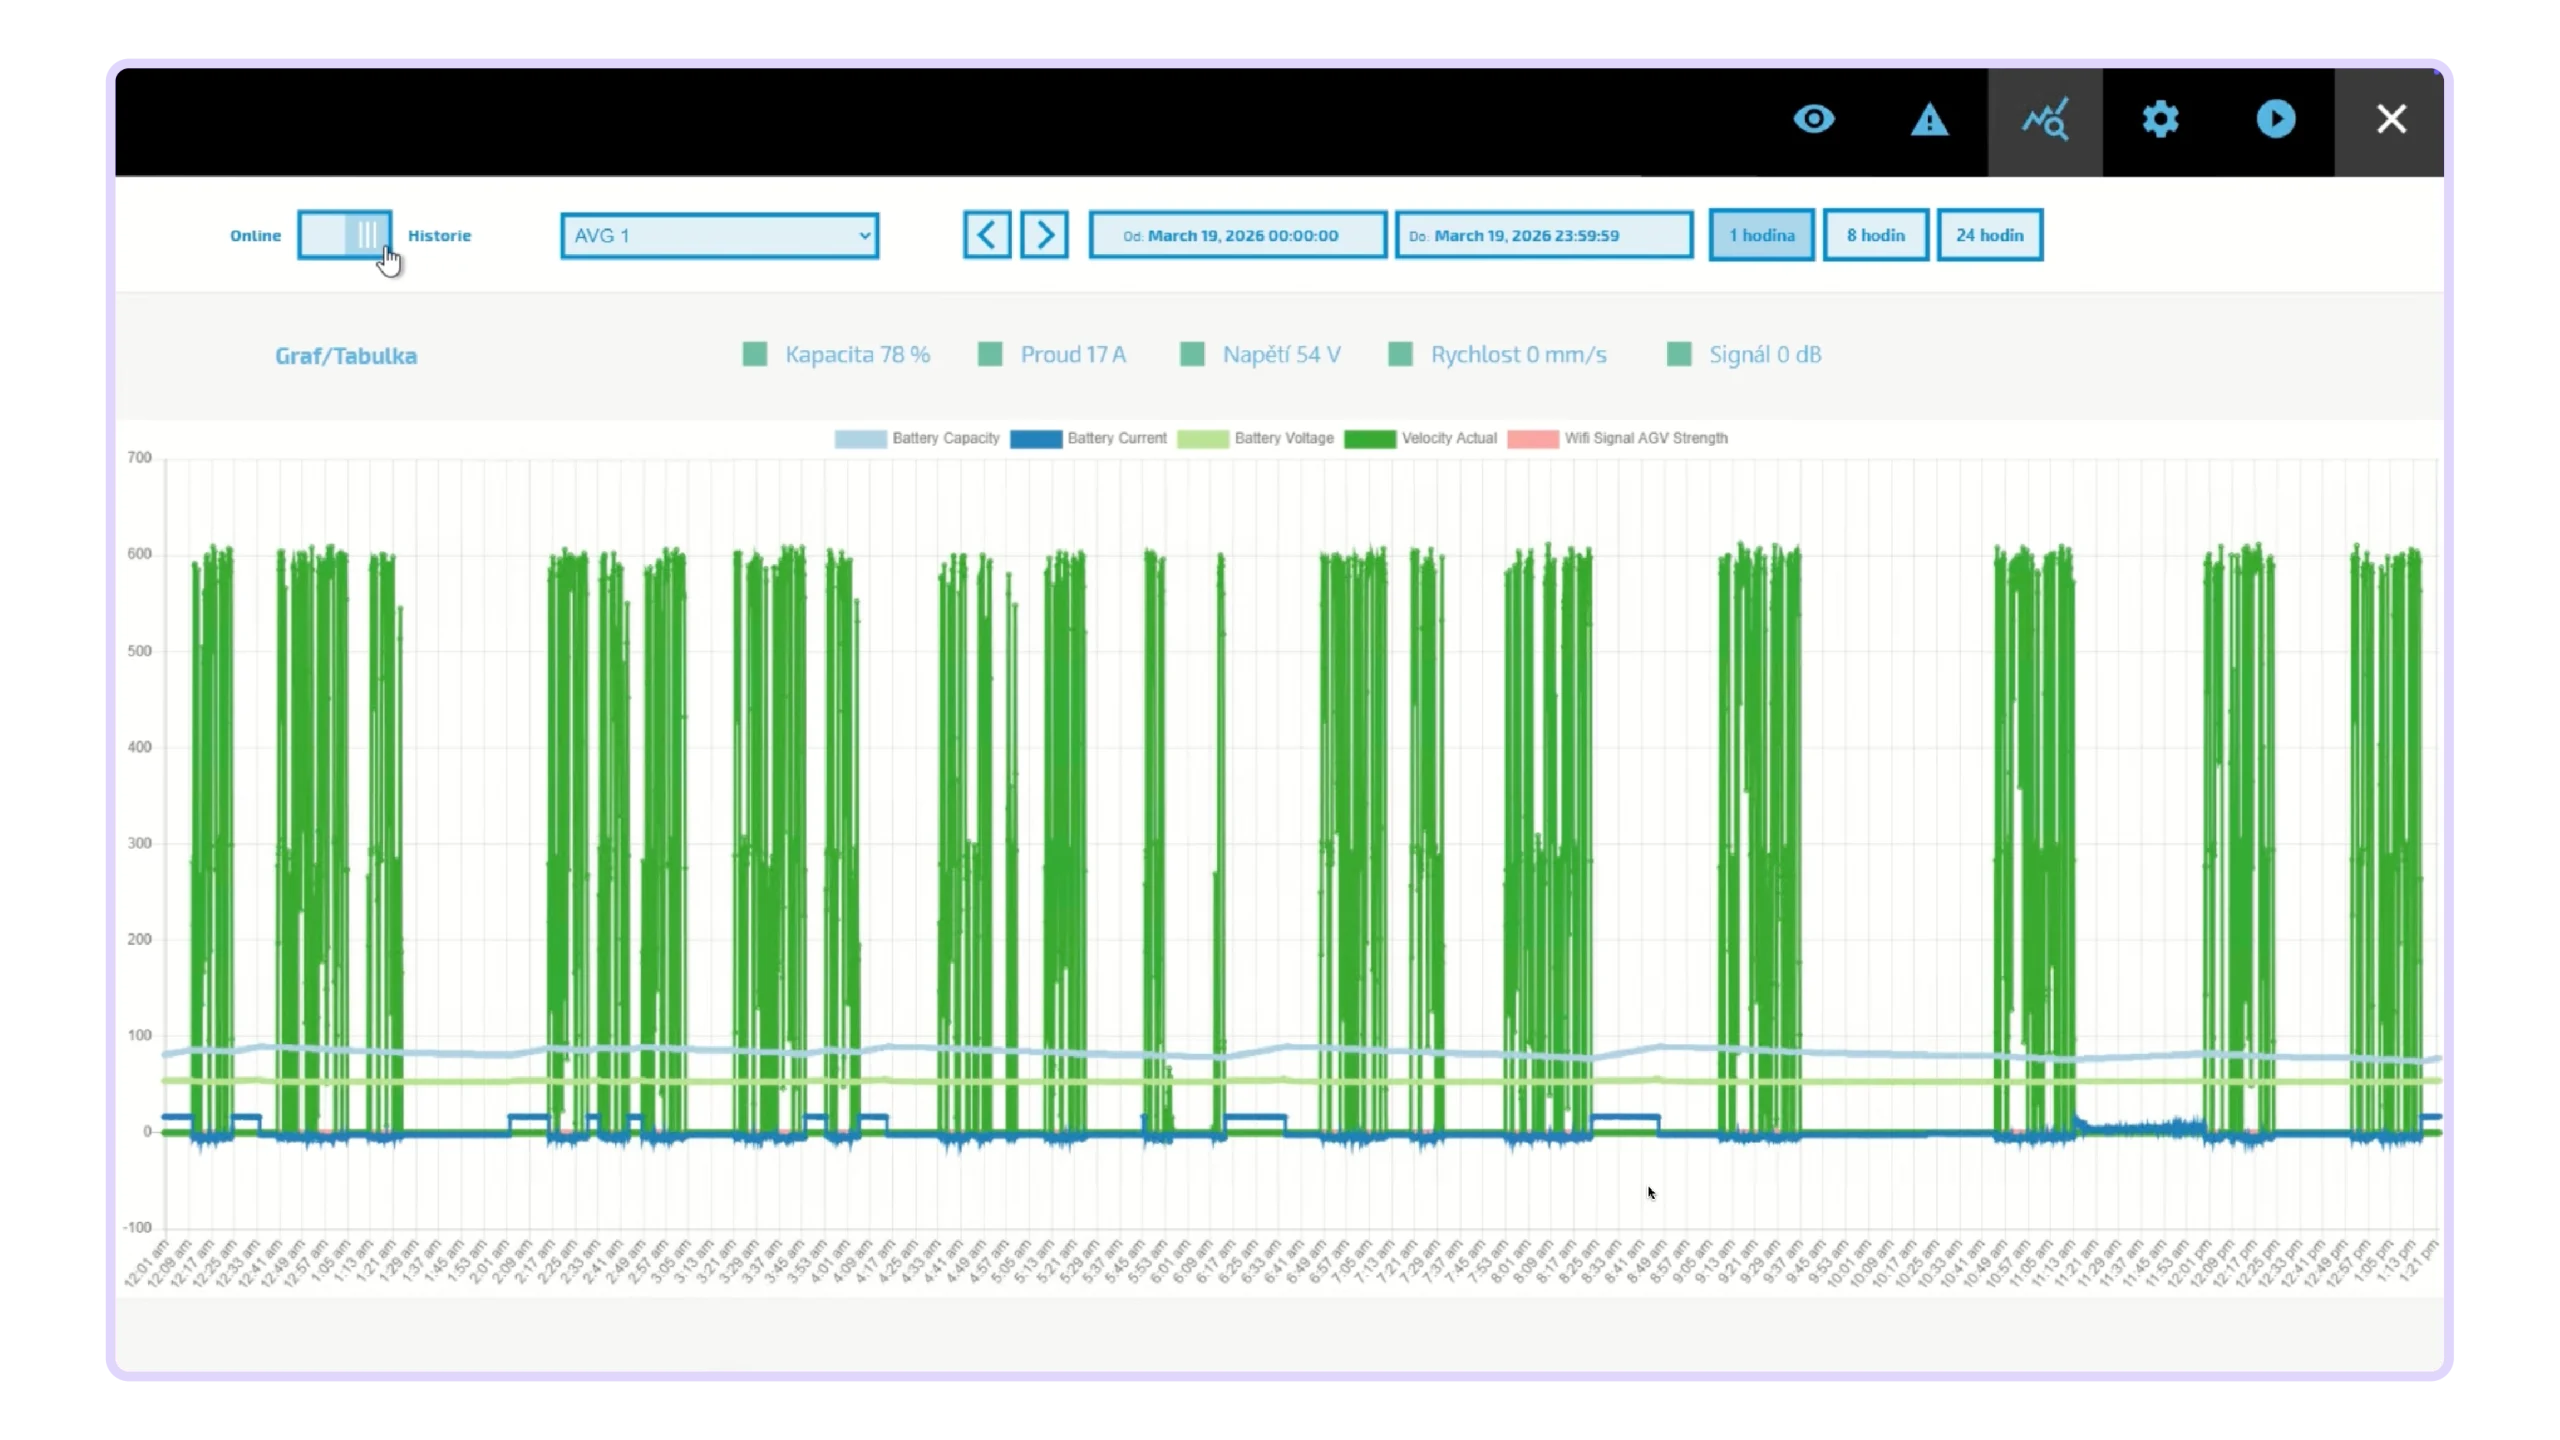
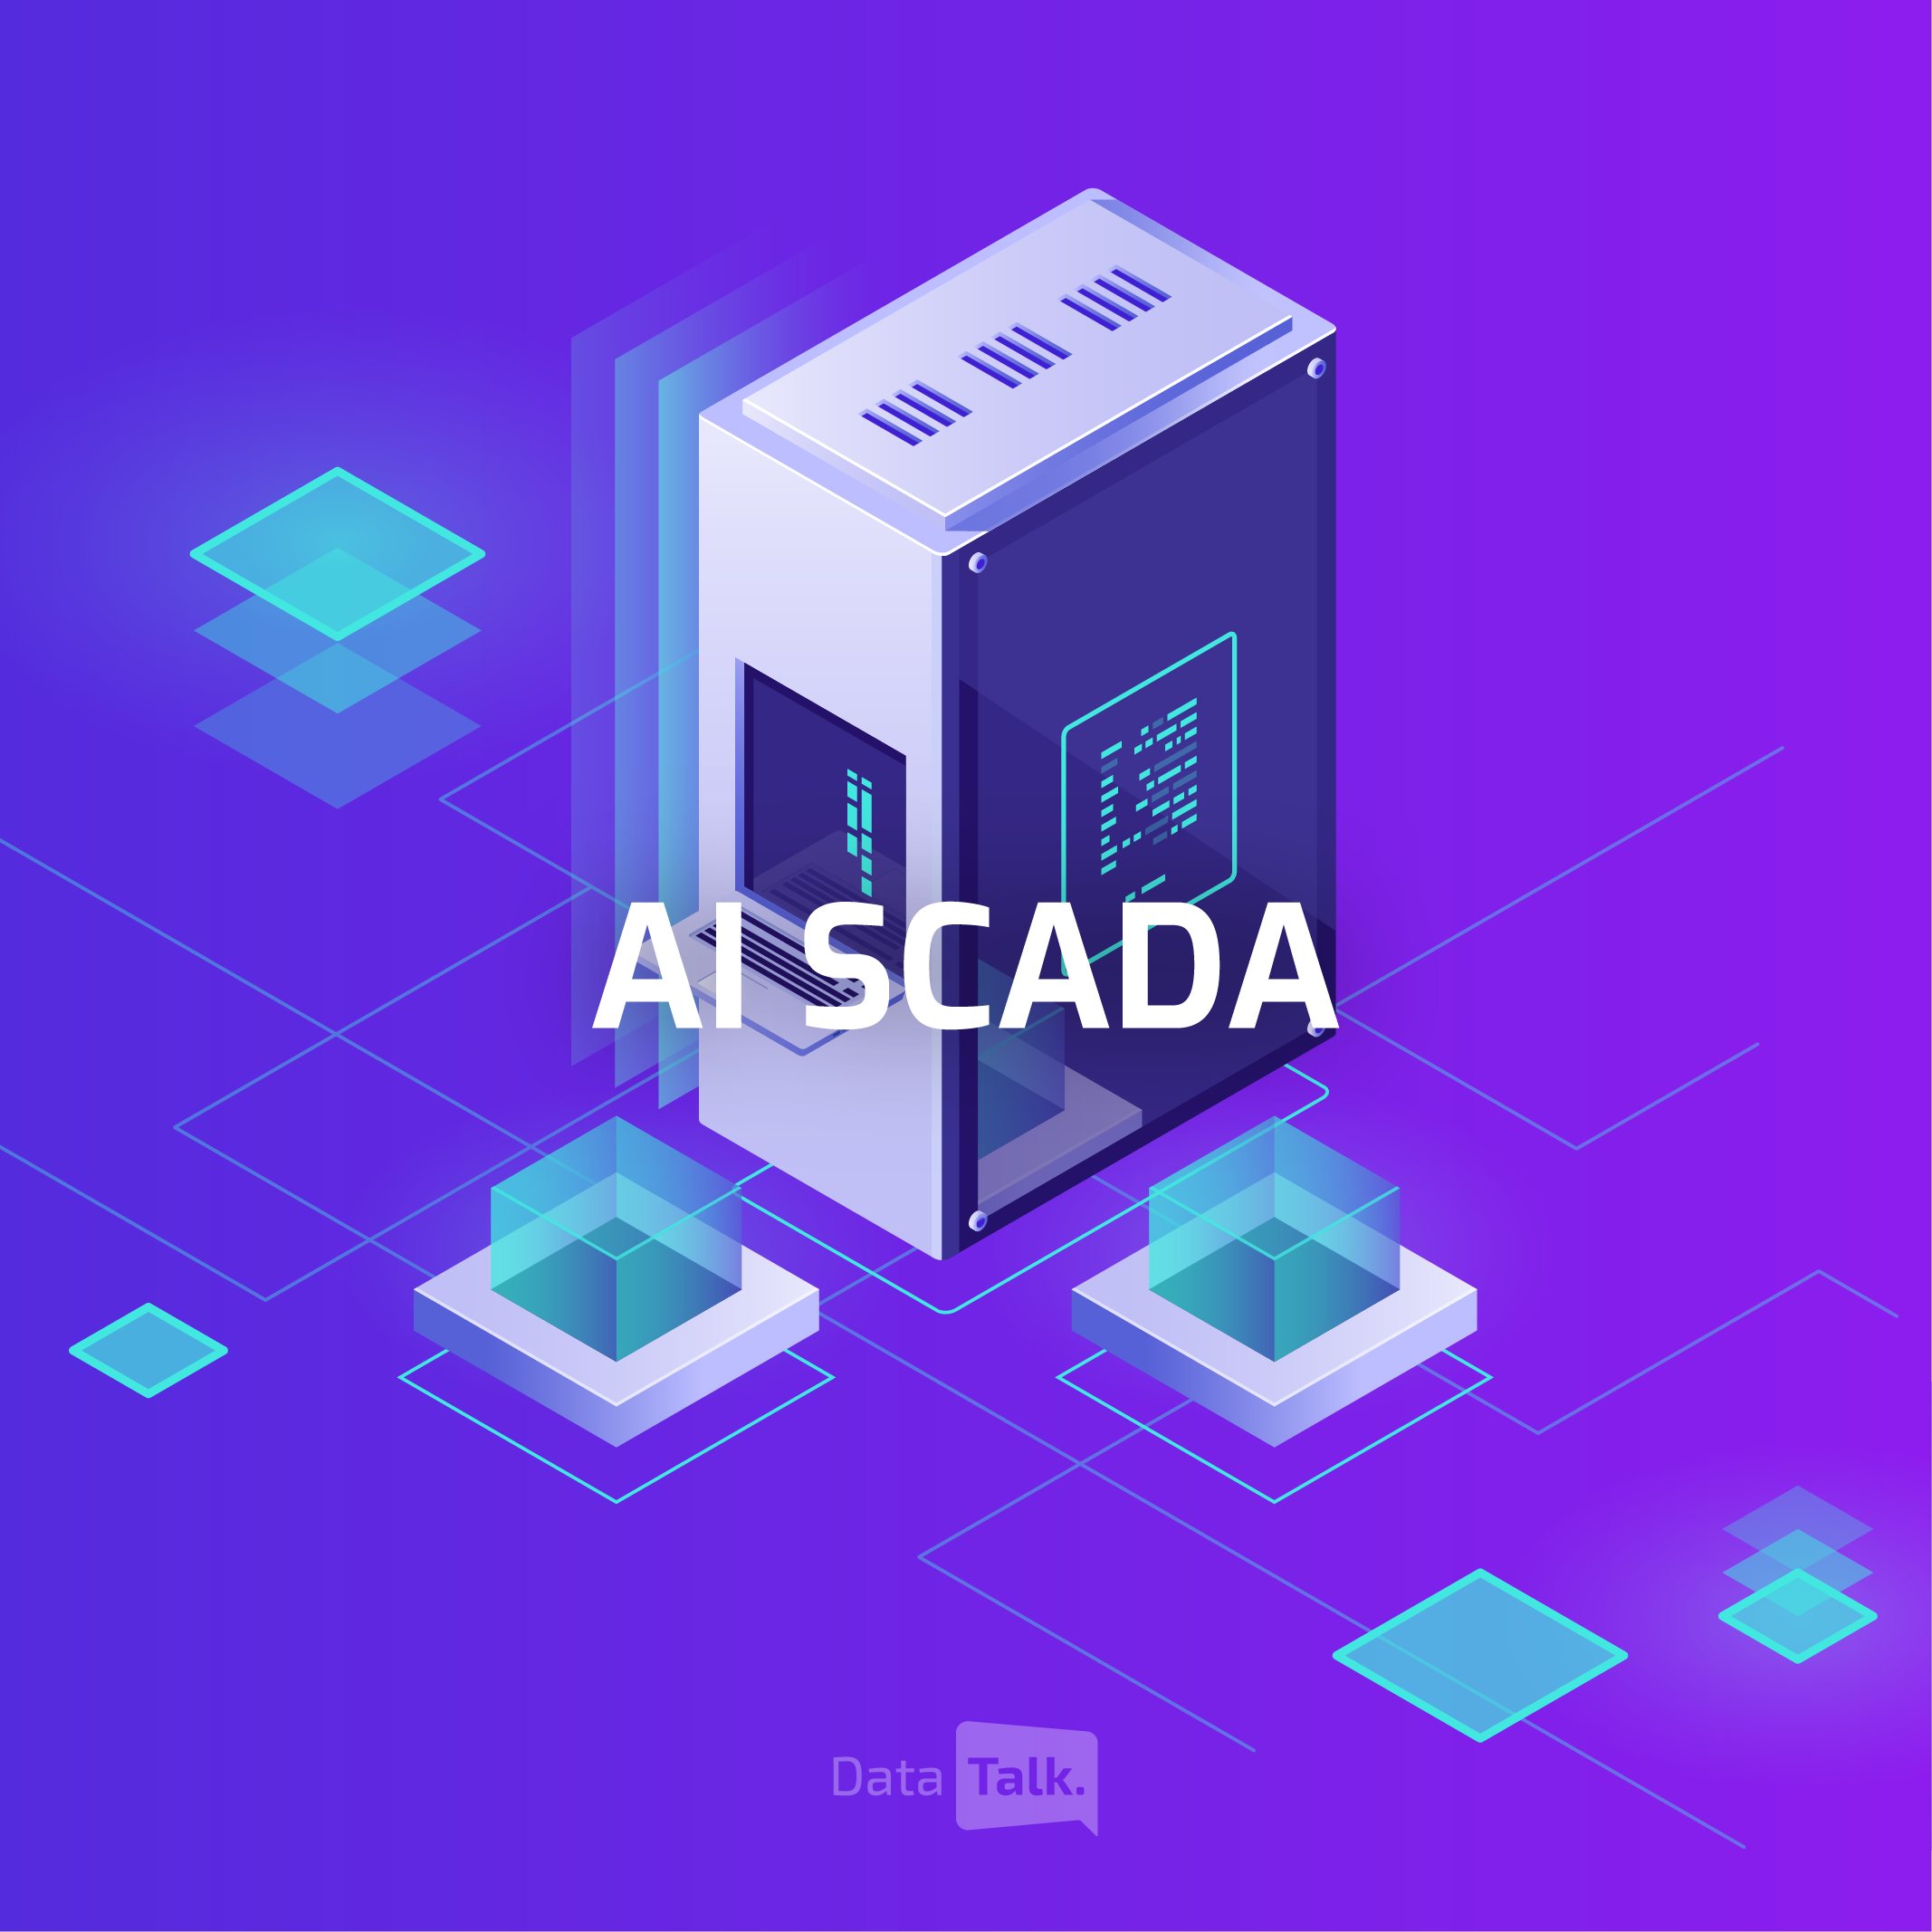
AI SCADA with its fully web-based platform and integrated real-time Project Designer comes loaded with AI-driven analytics, 2D/3D views, live dashboards, advanced charts etc. and a no-code graphical compute module.
Connect, Log & Report
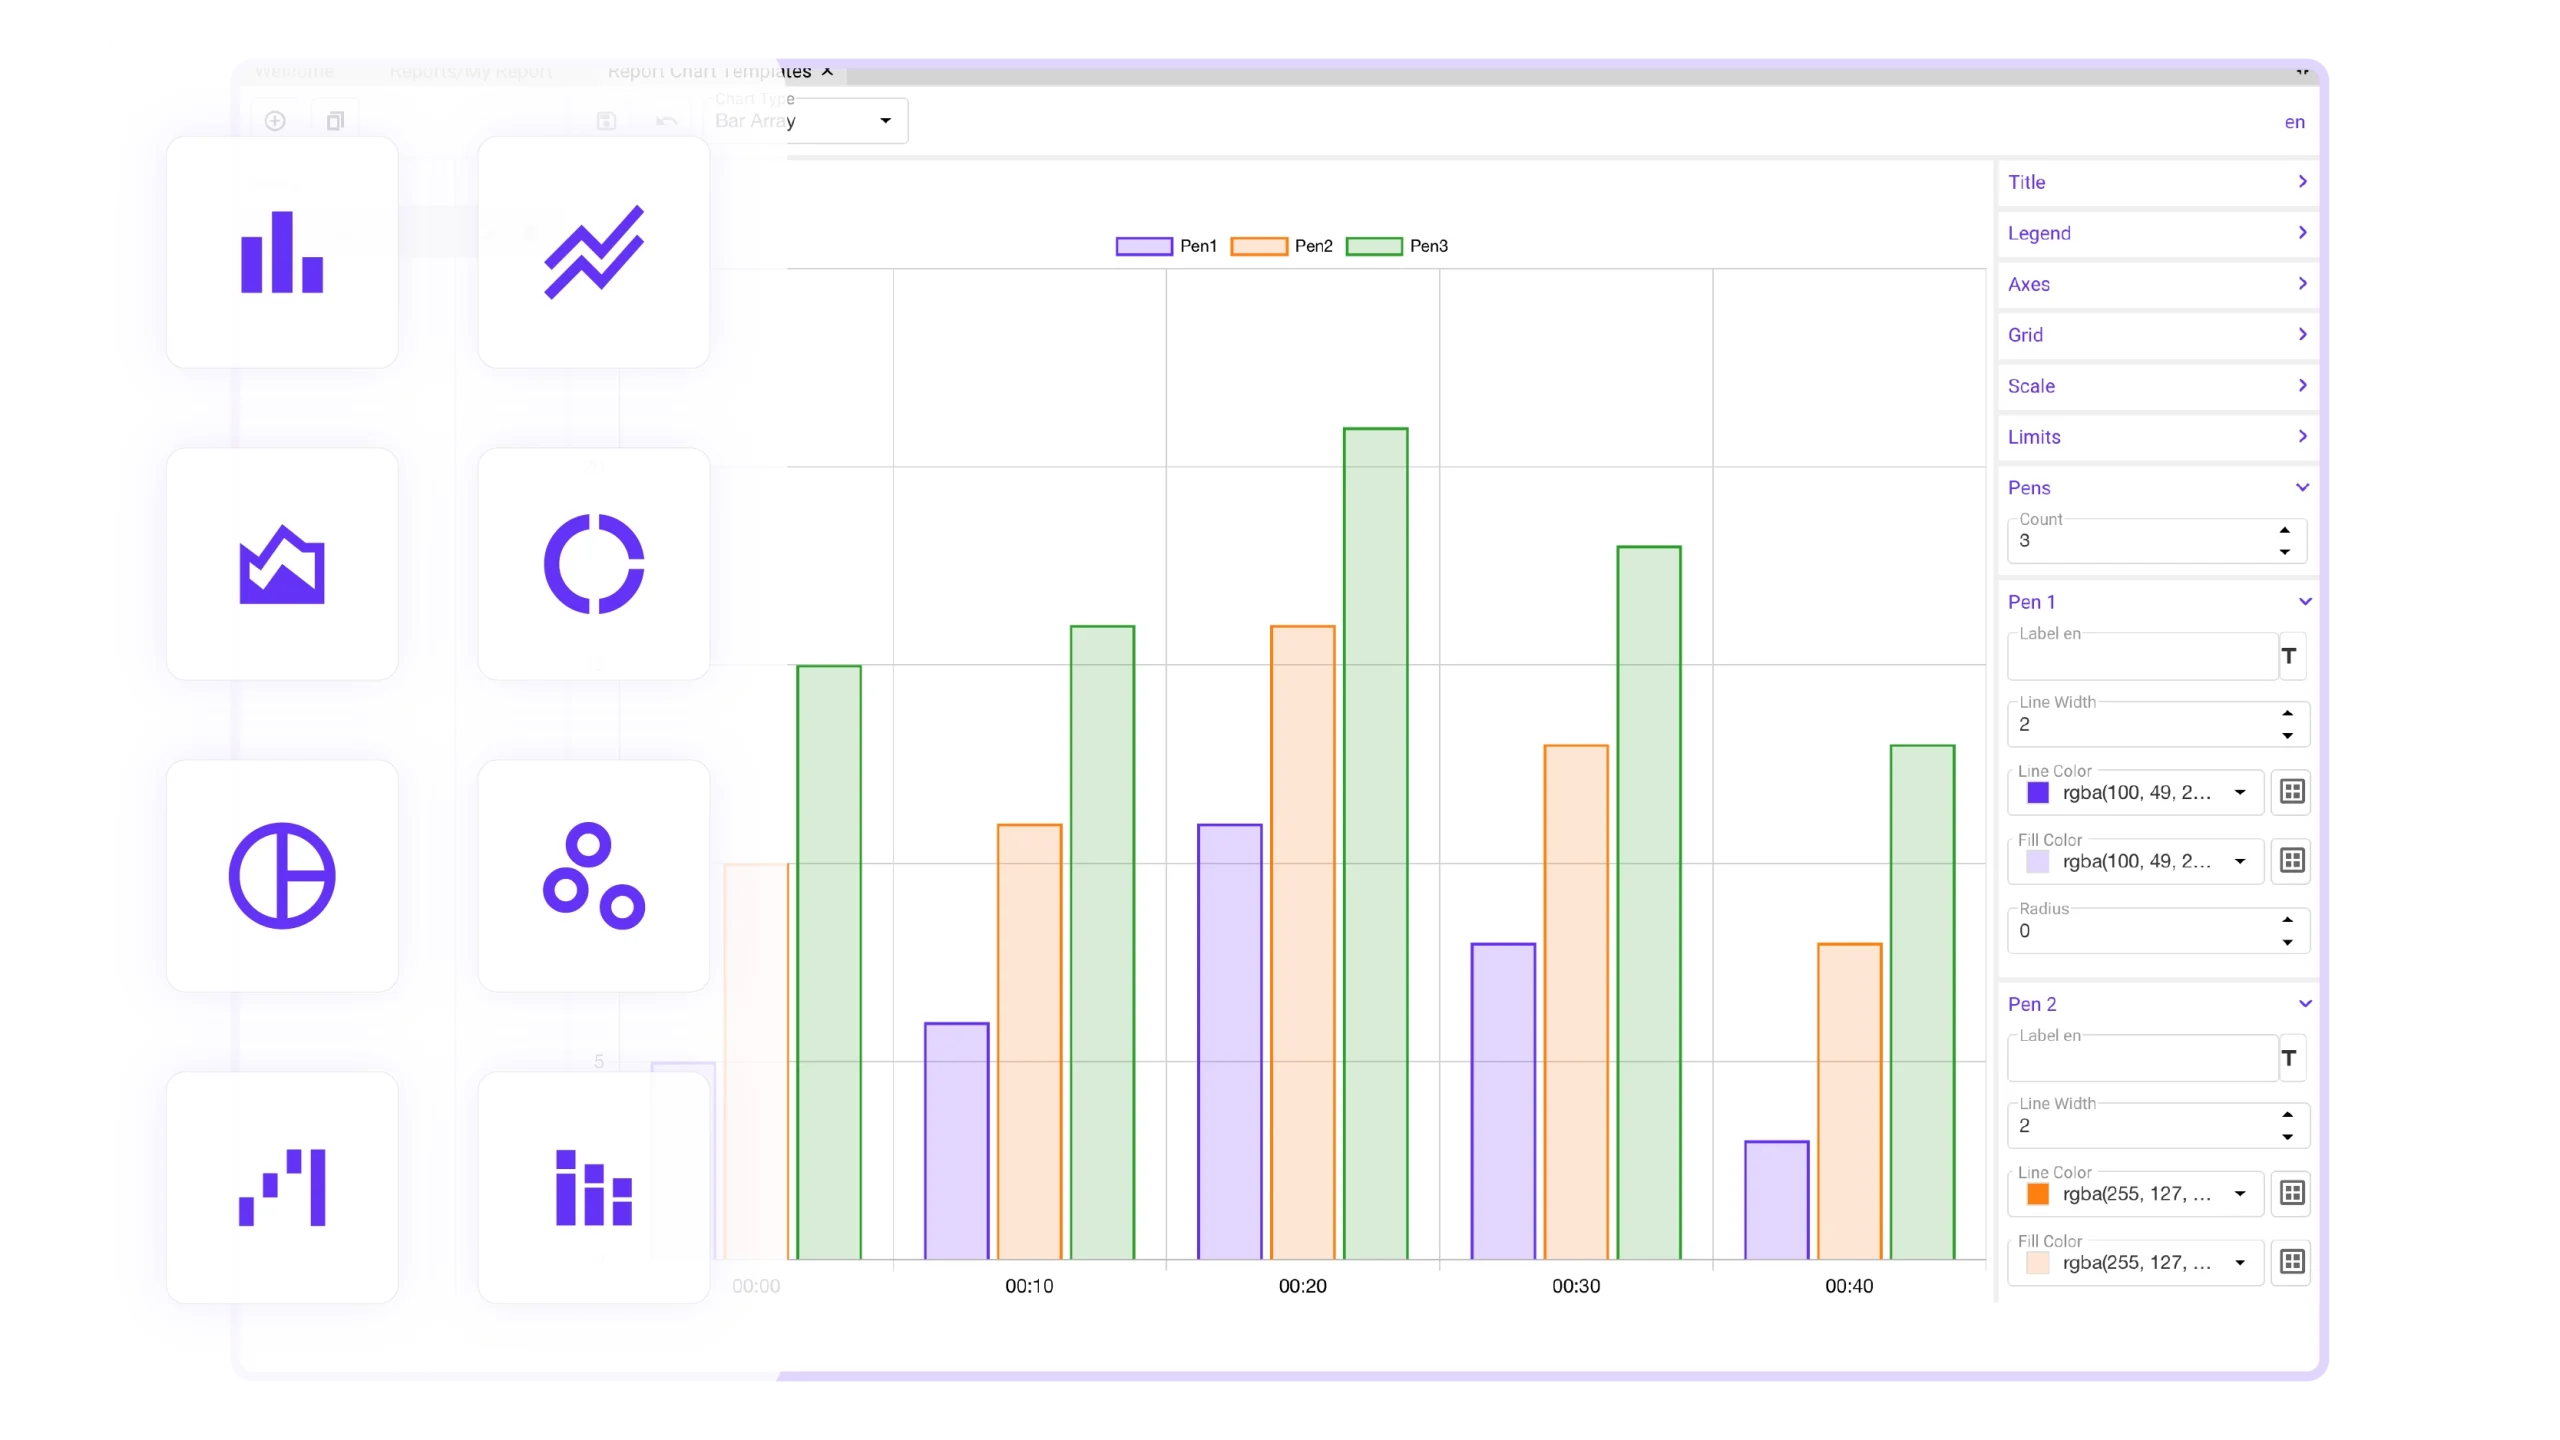
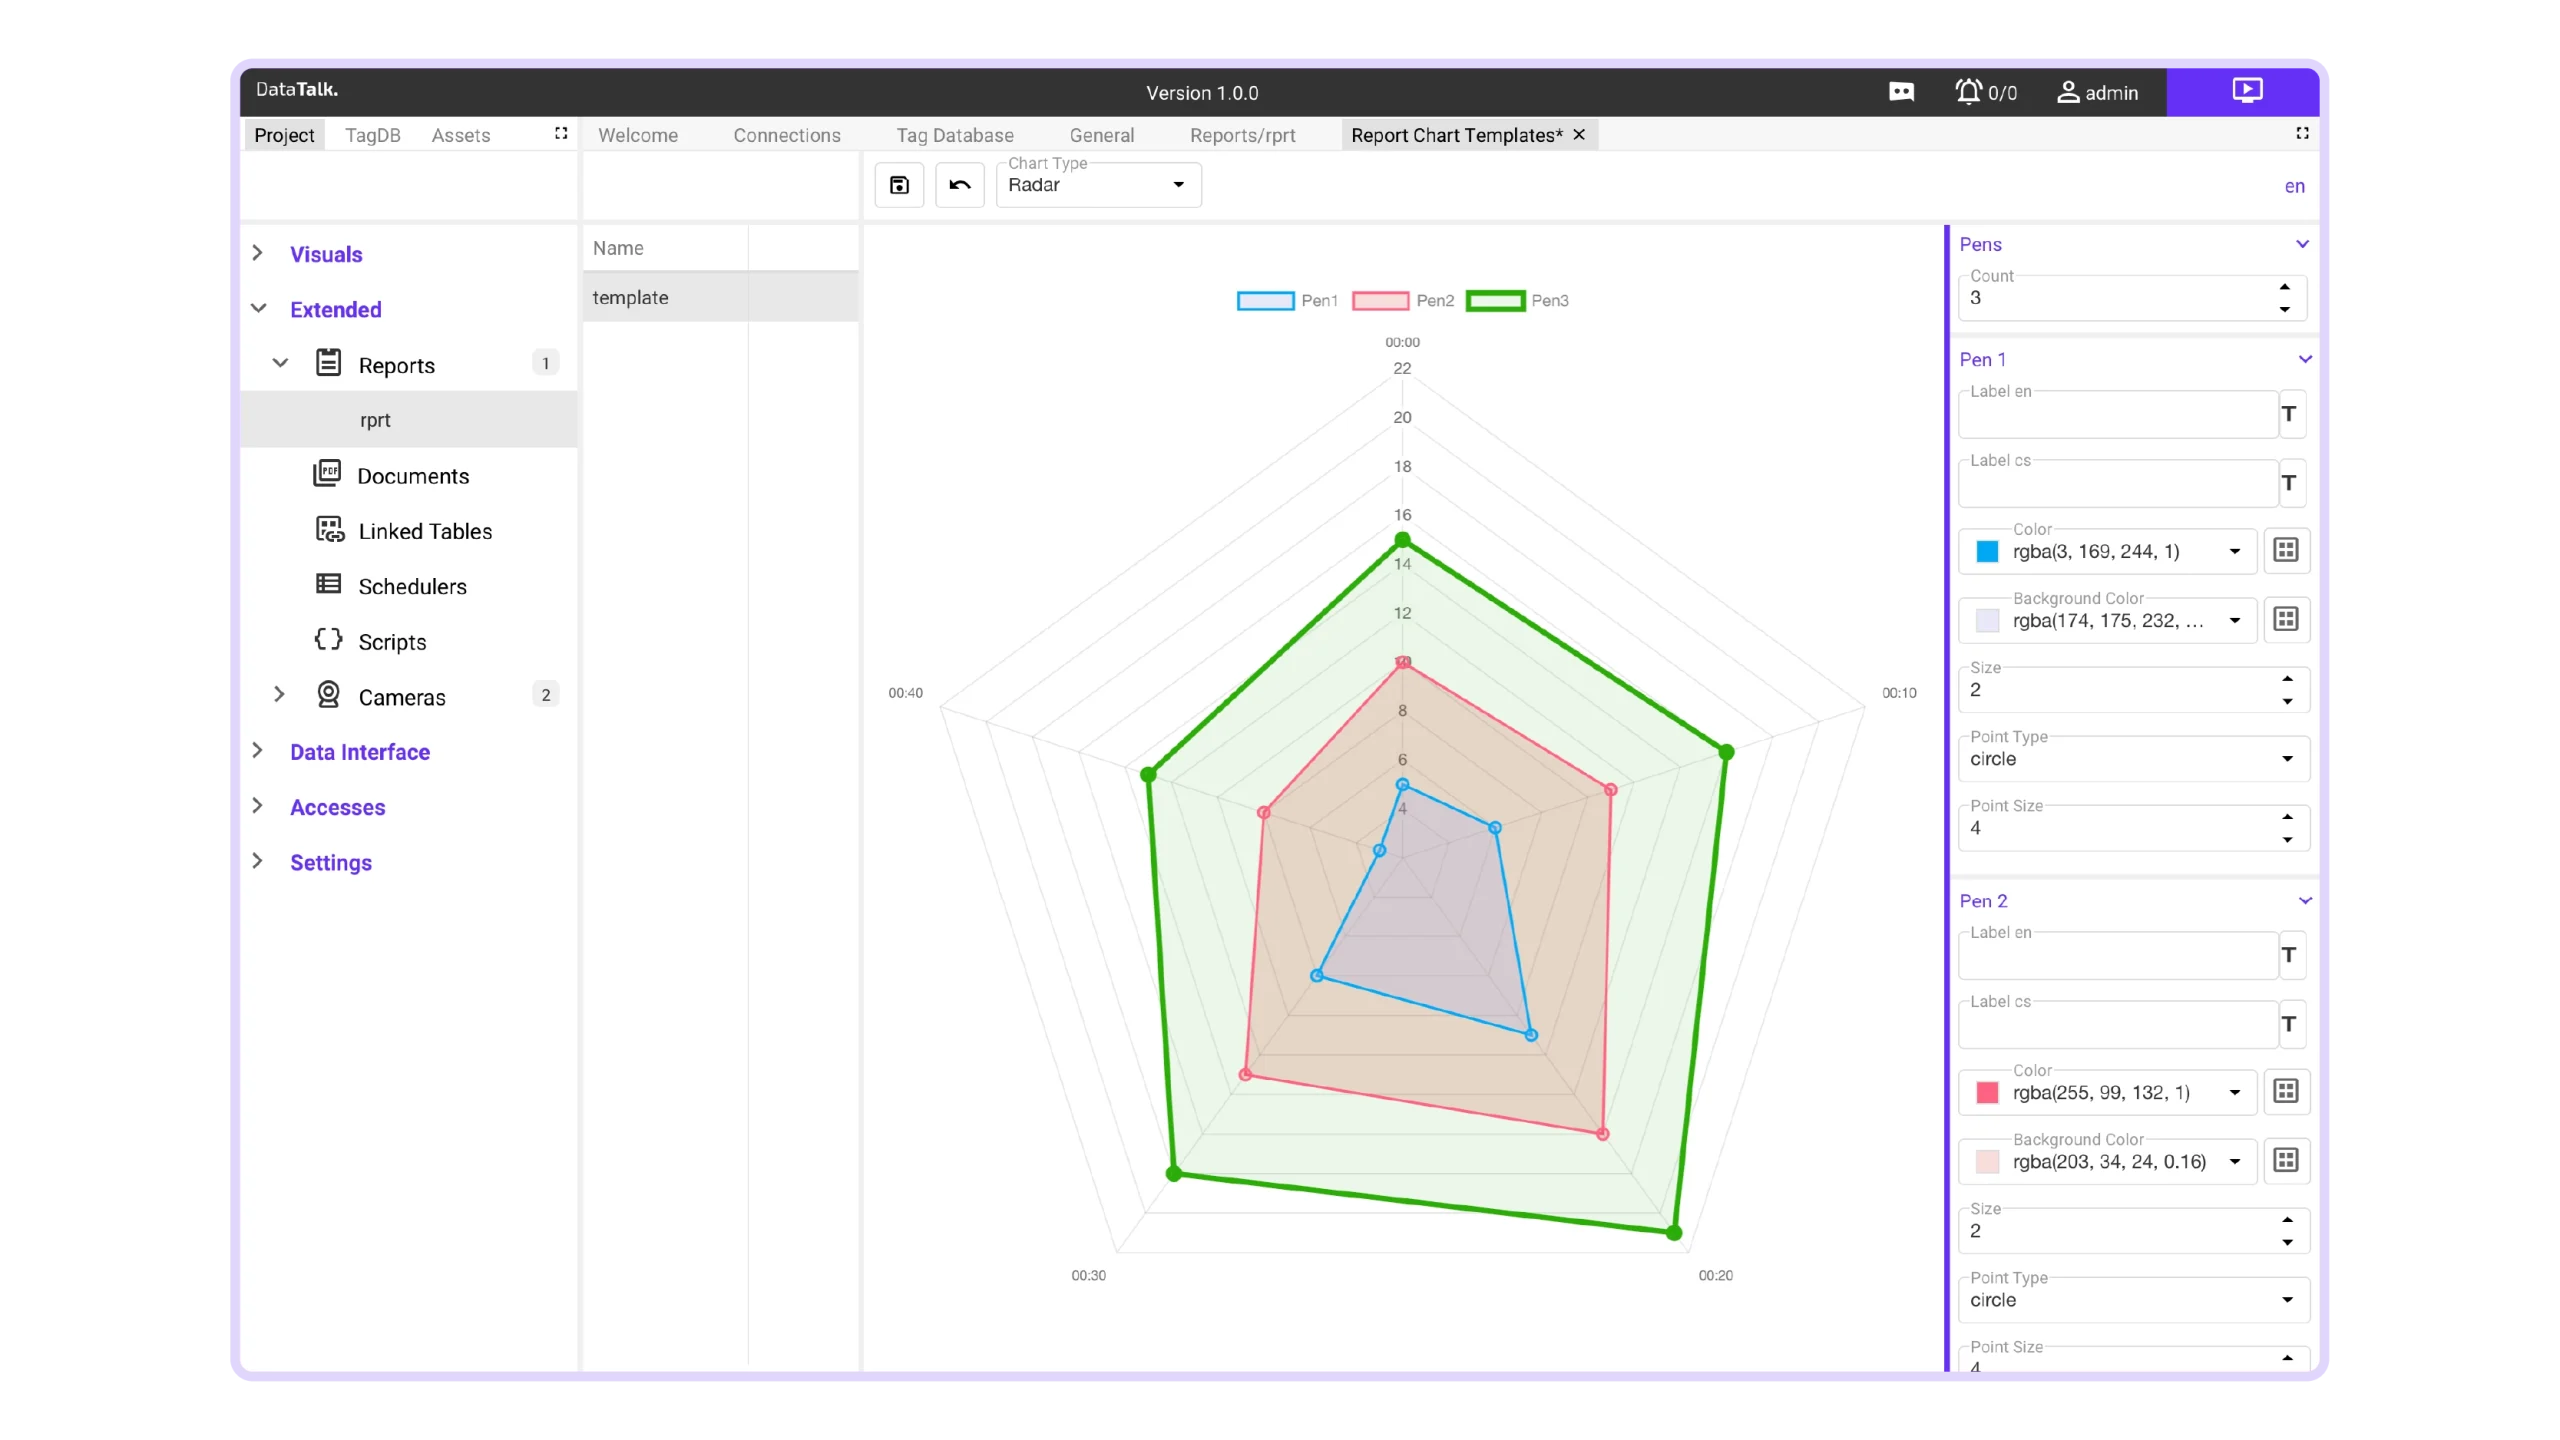
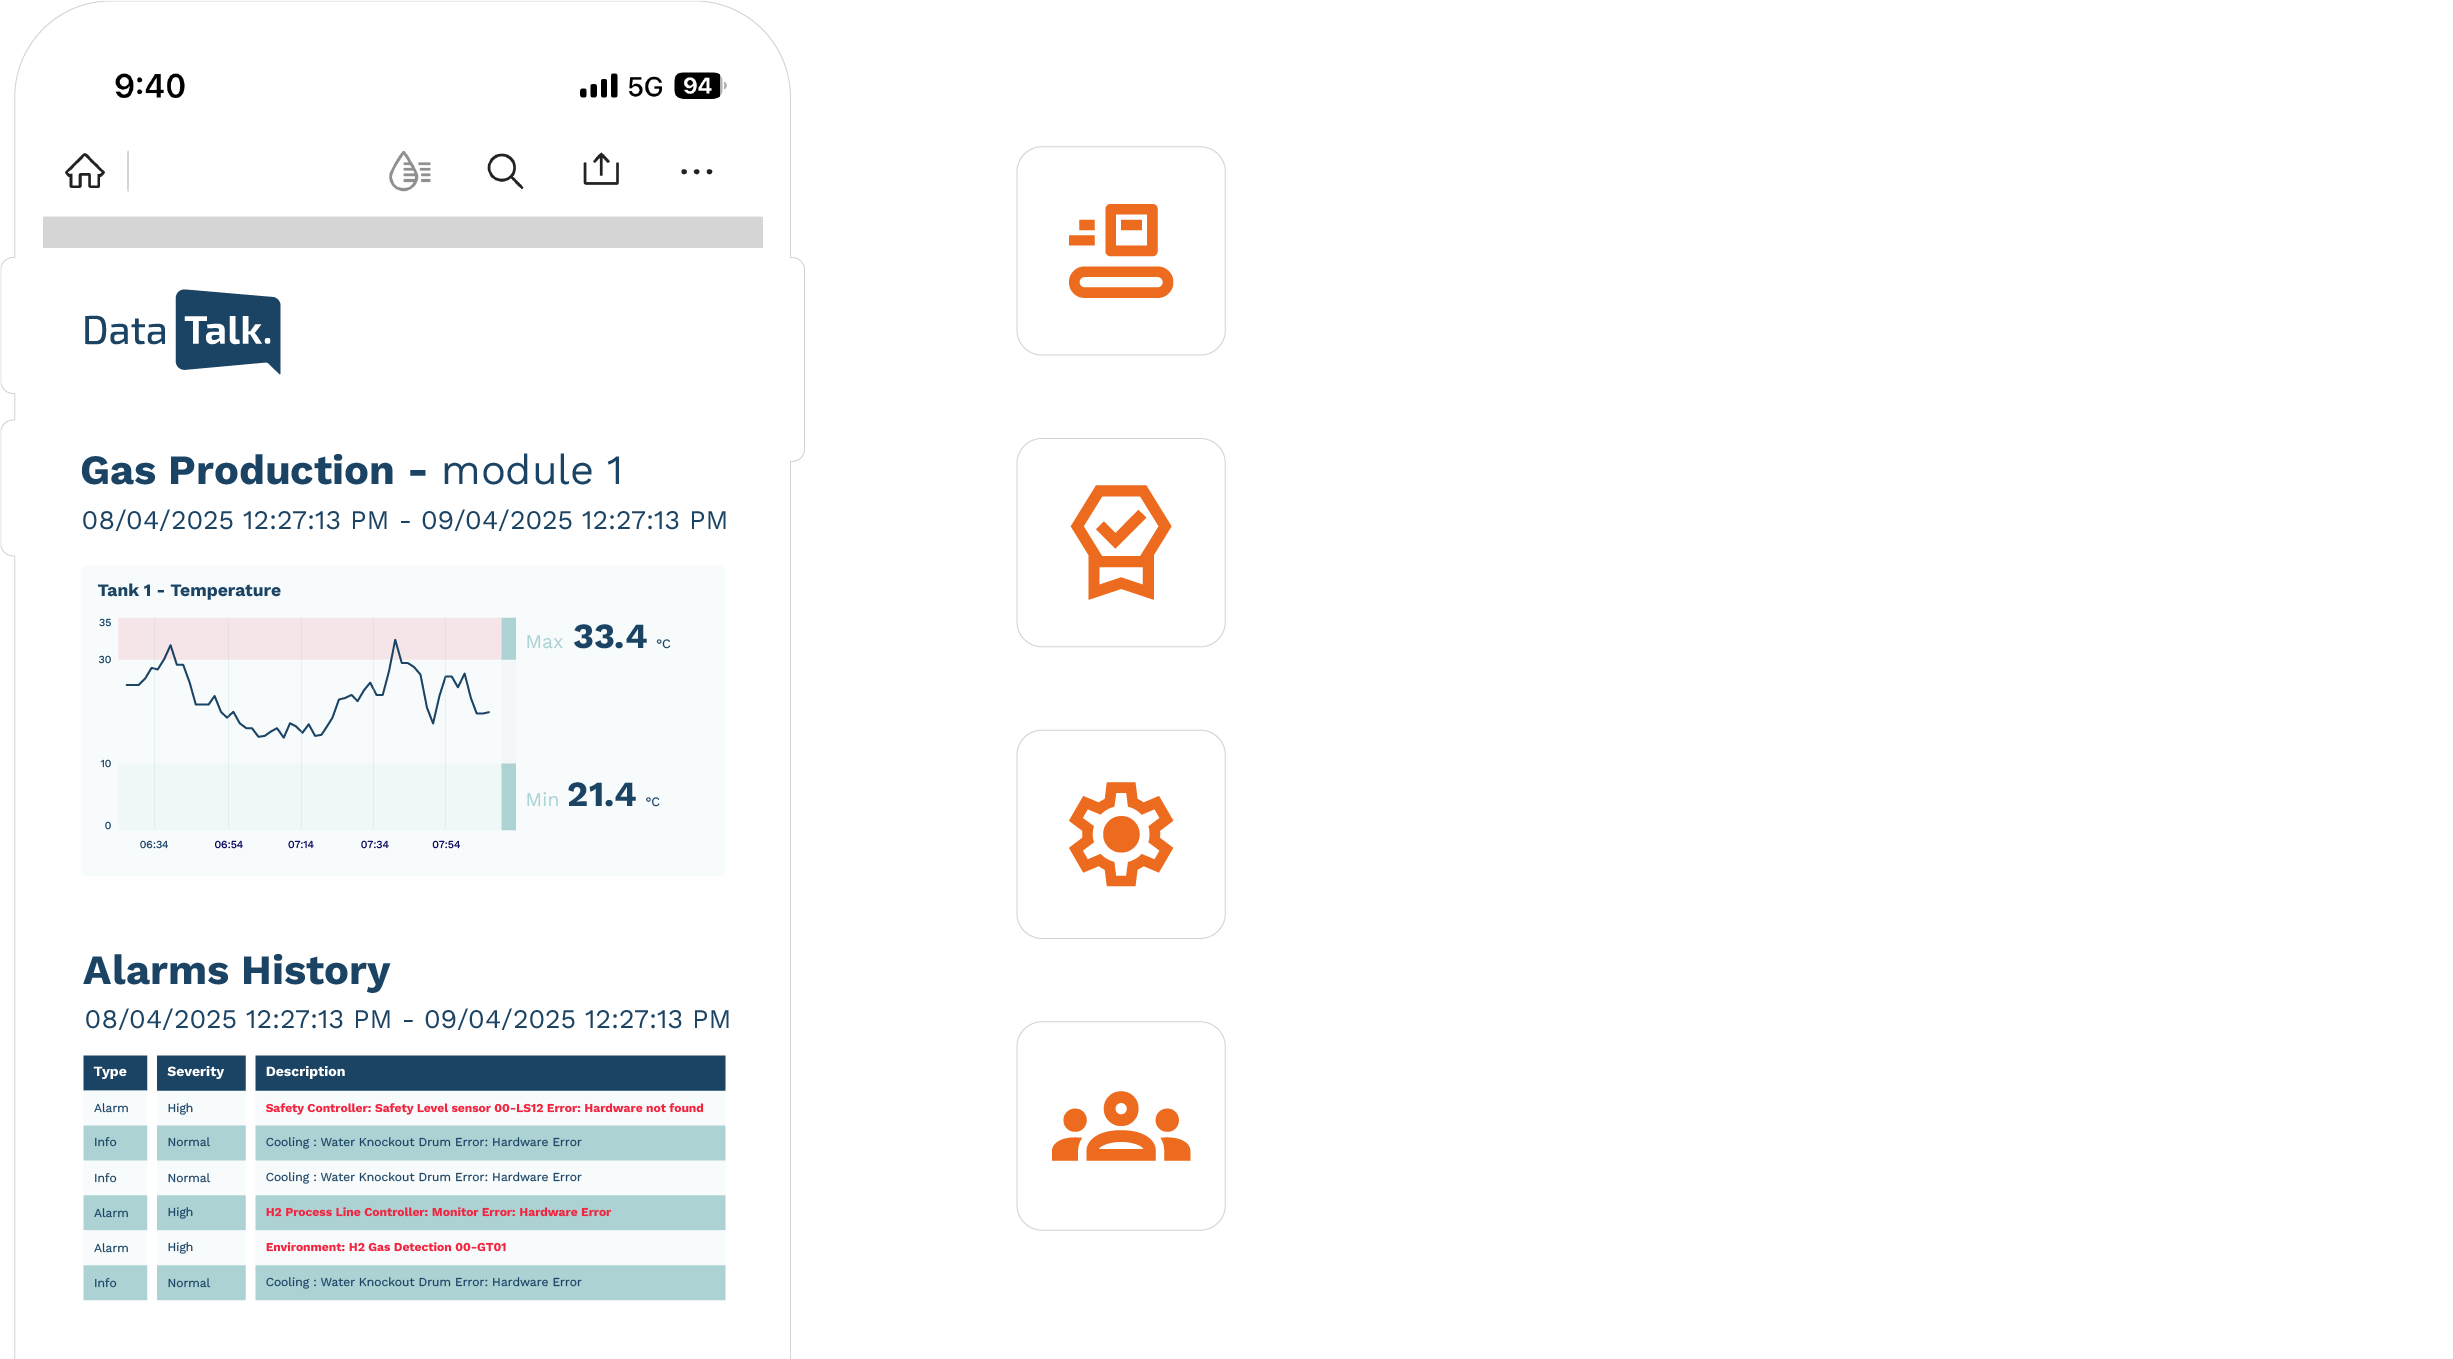
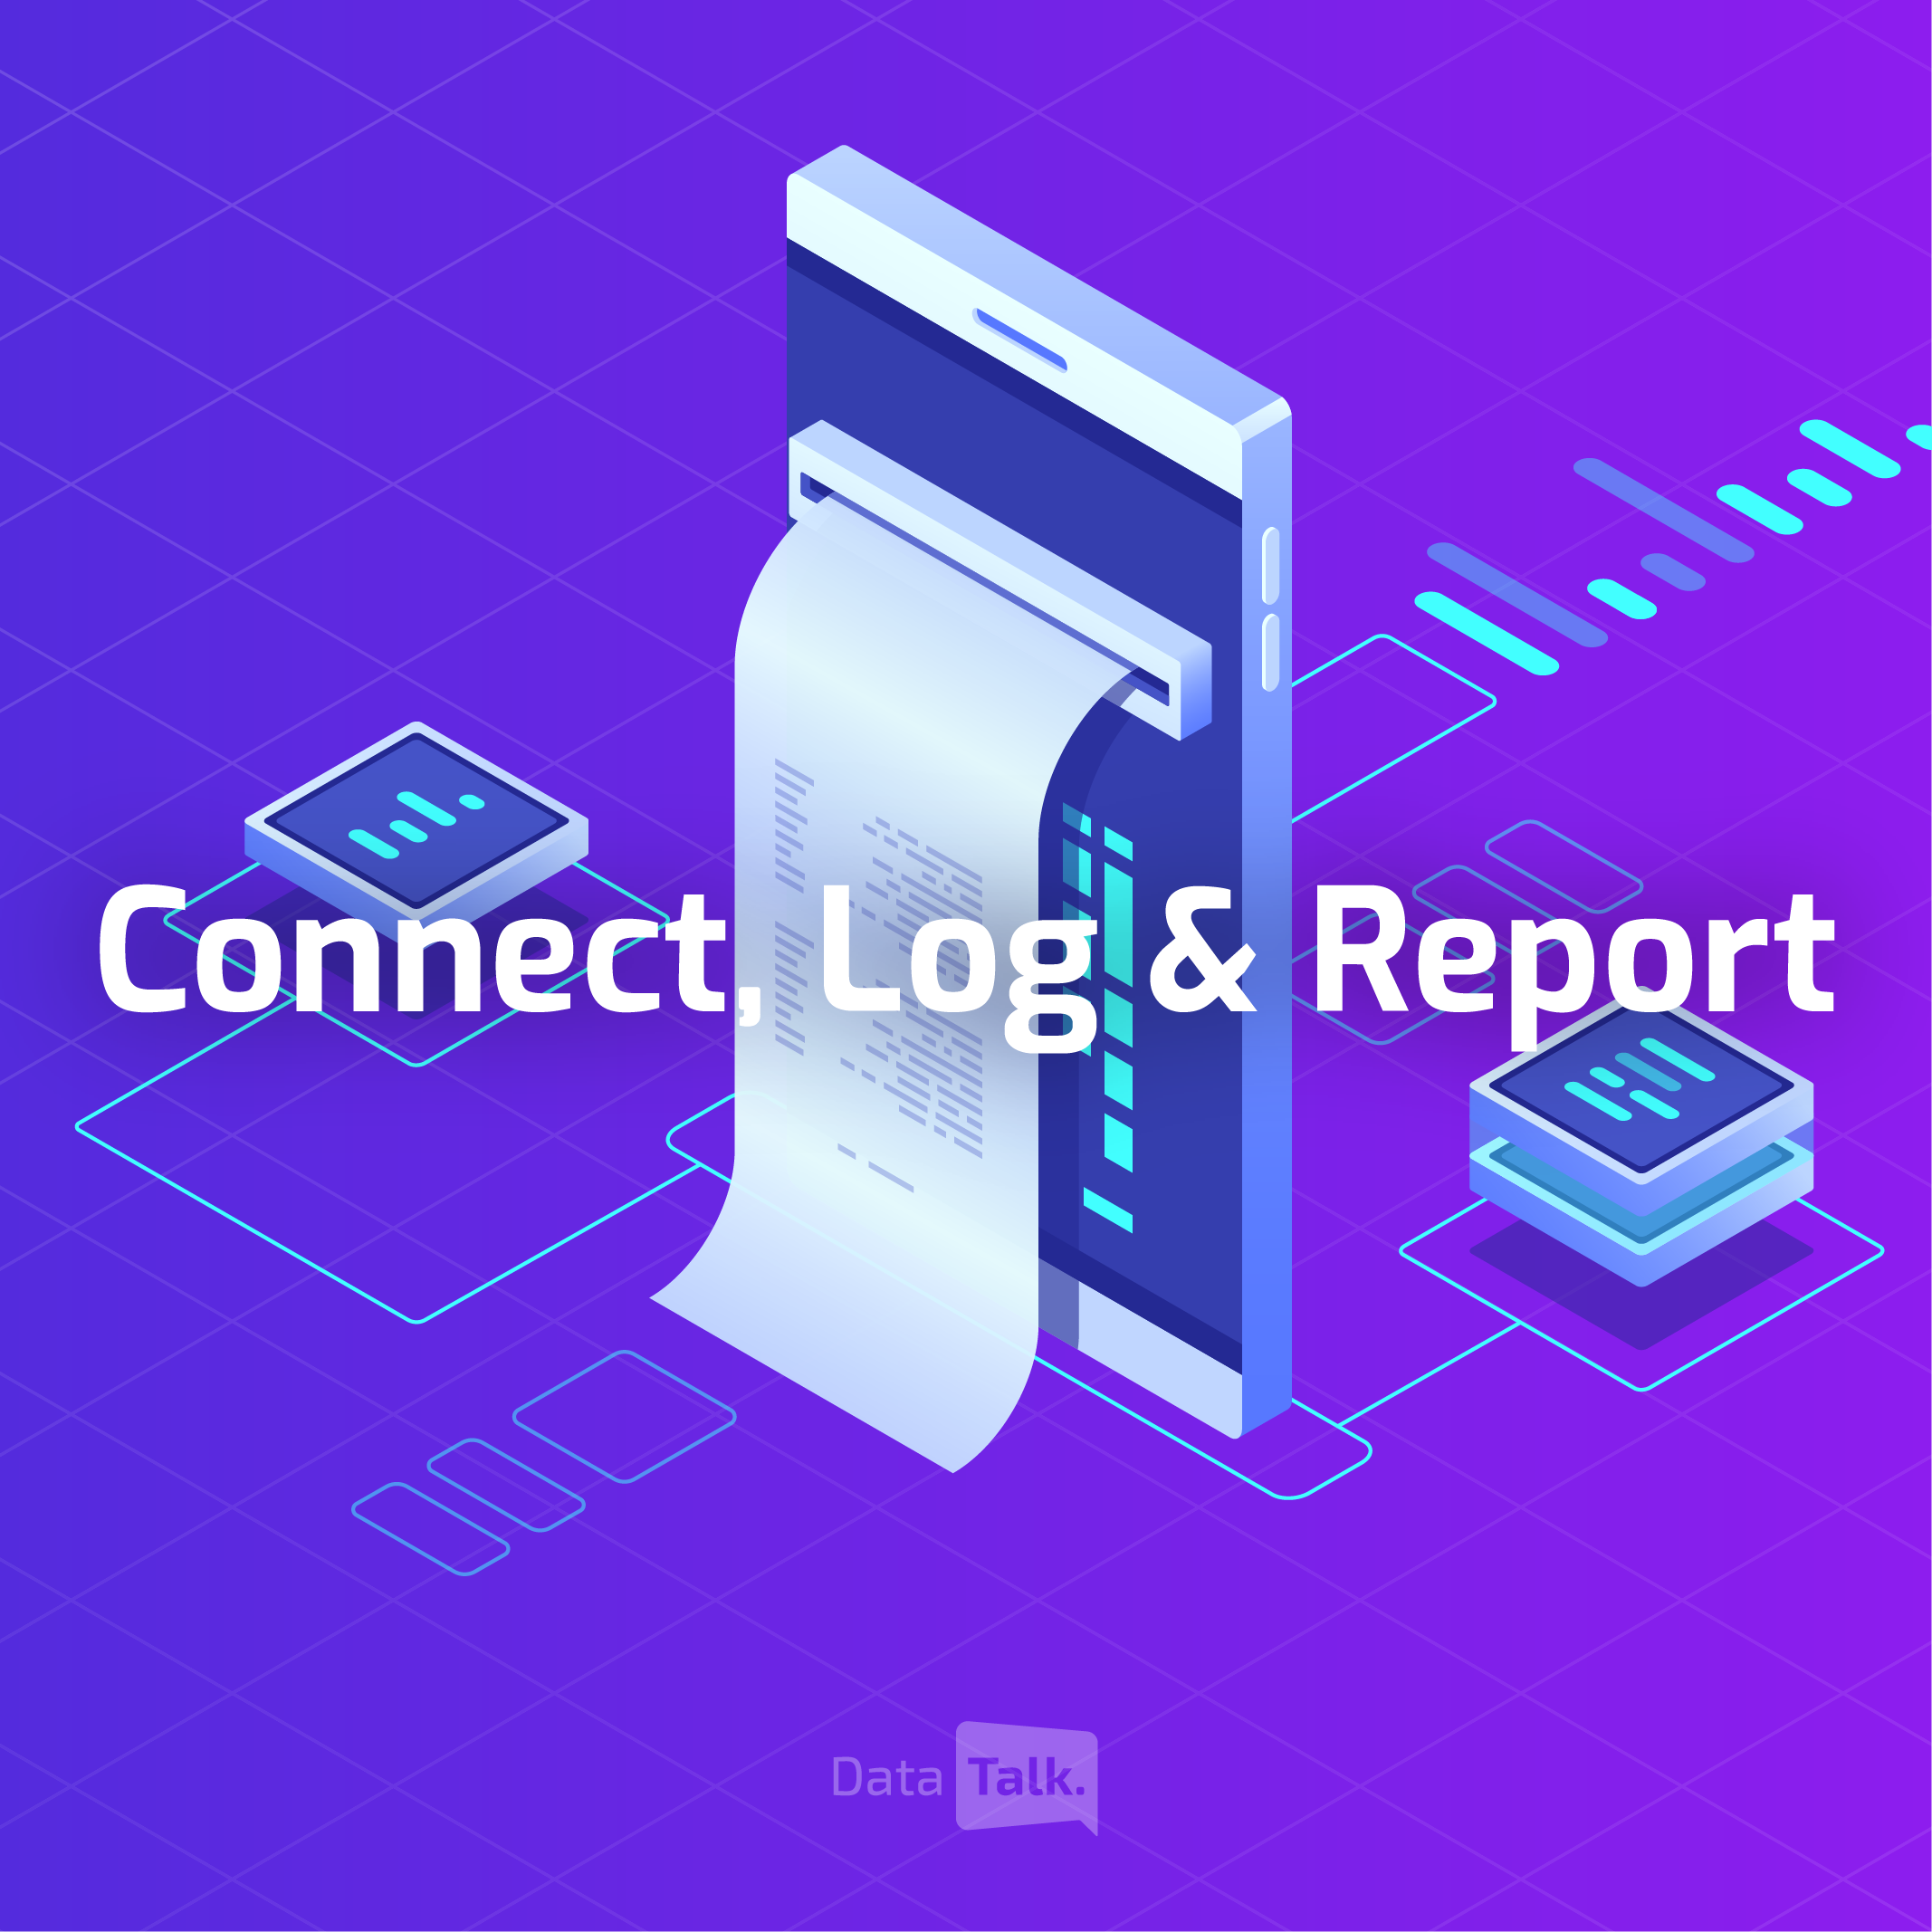
This product creates periodic reports (using charts, tables, images) of your technology, automatically generated from user-designed templates in MS Word or Excel.
Web HMI
This product creates periodic reports (using charts, tables, images) of your technology, automatically generated from user-designed templates in MS Word or Excel.
Real-time Dashboards
This product creates periodic reports (using charts, tables, images) of your technology, automatically generated from user-designed templates in MS Word or Excel.
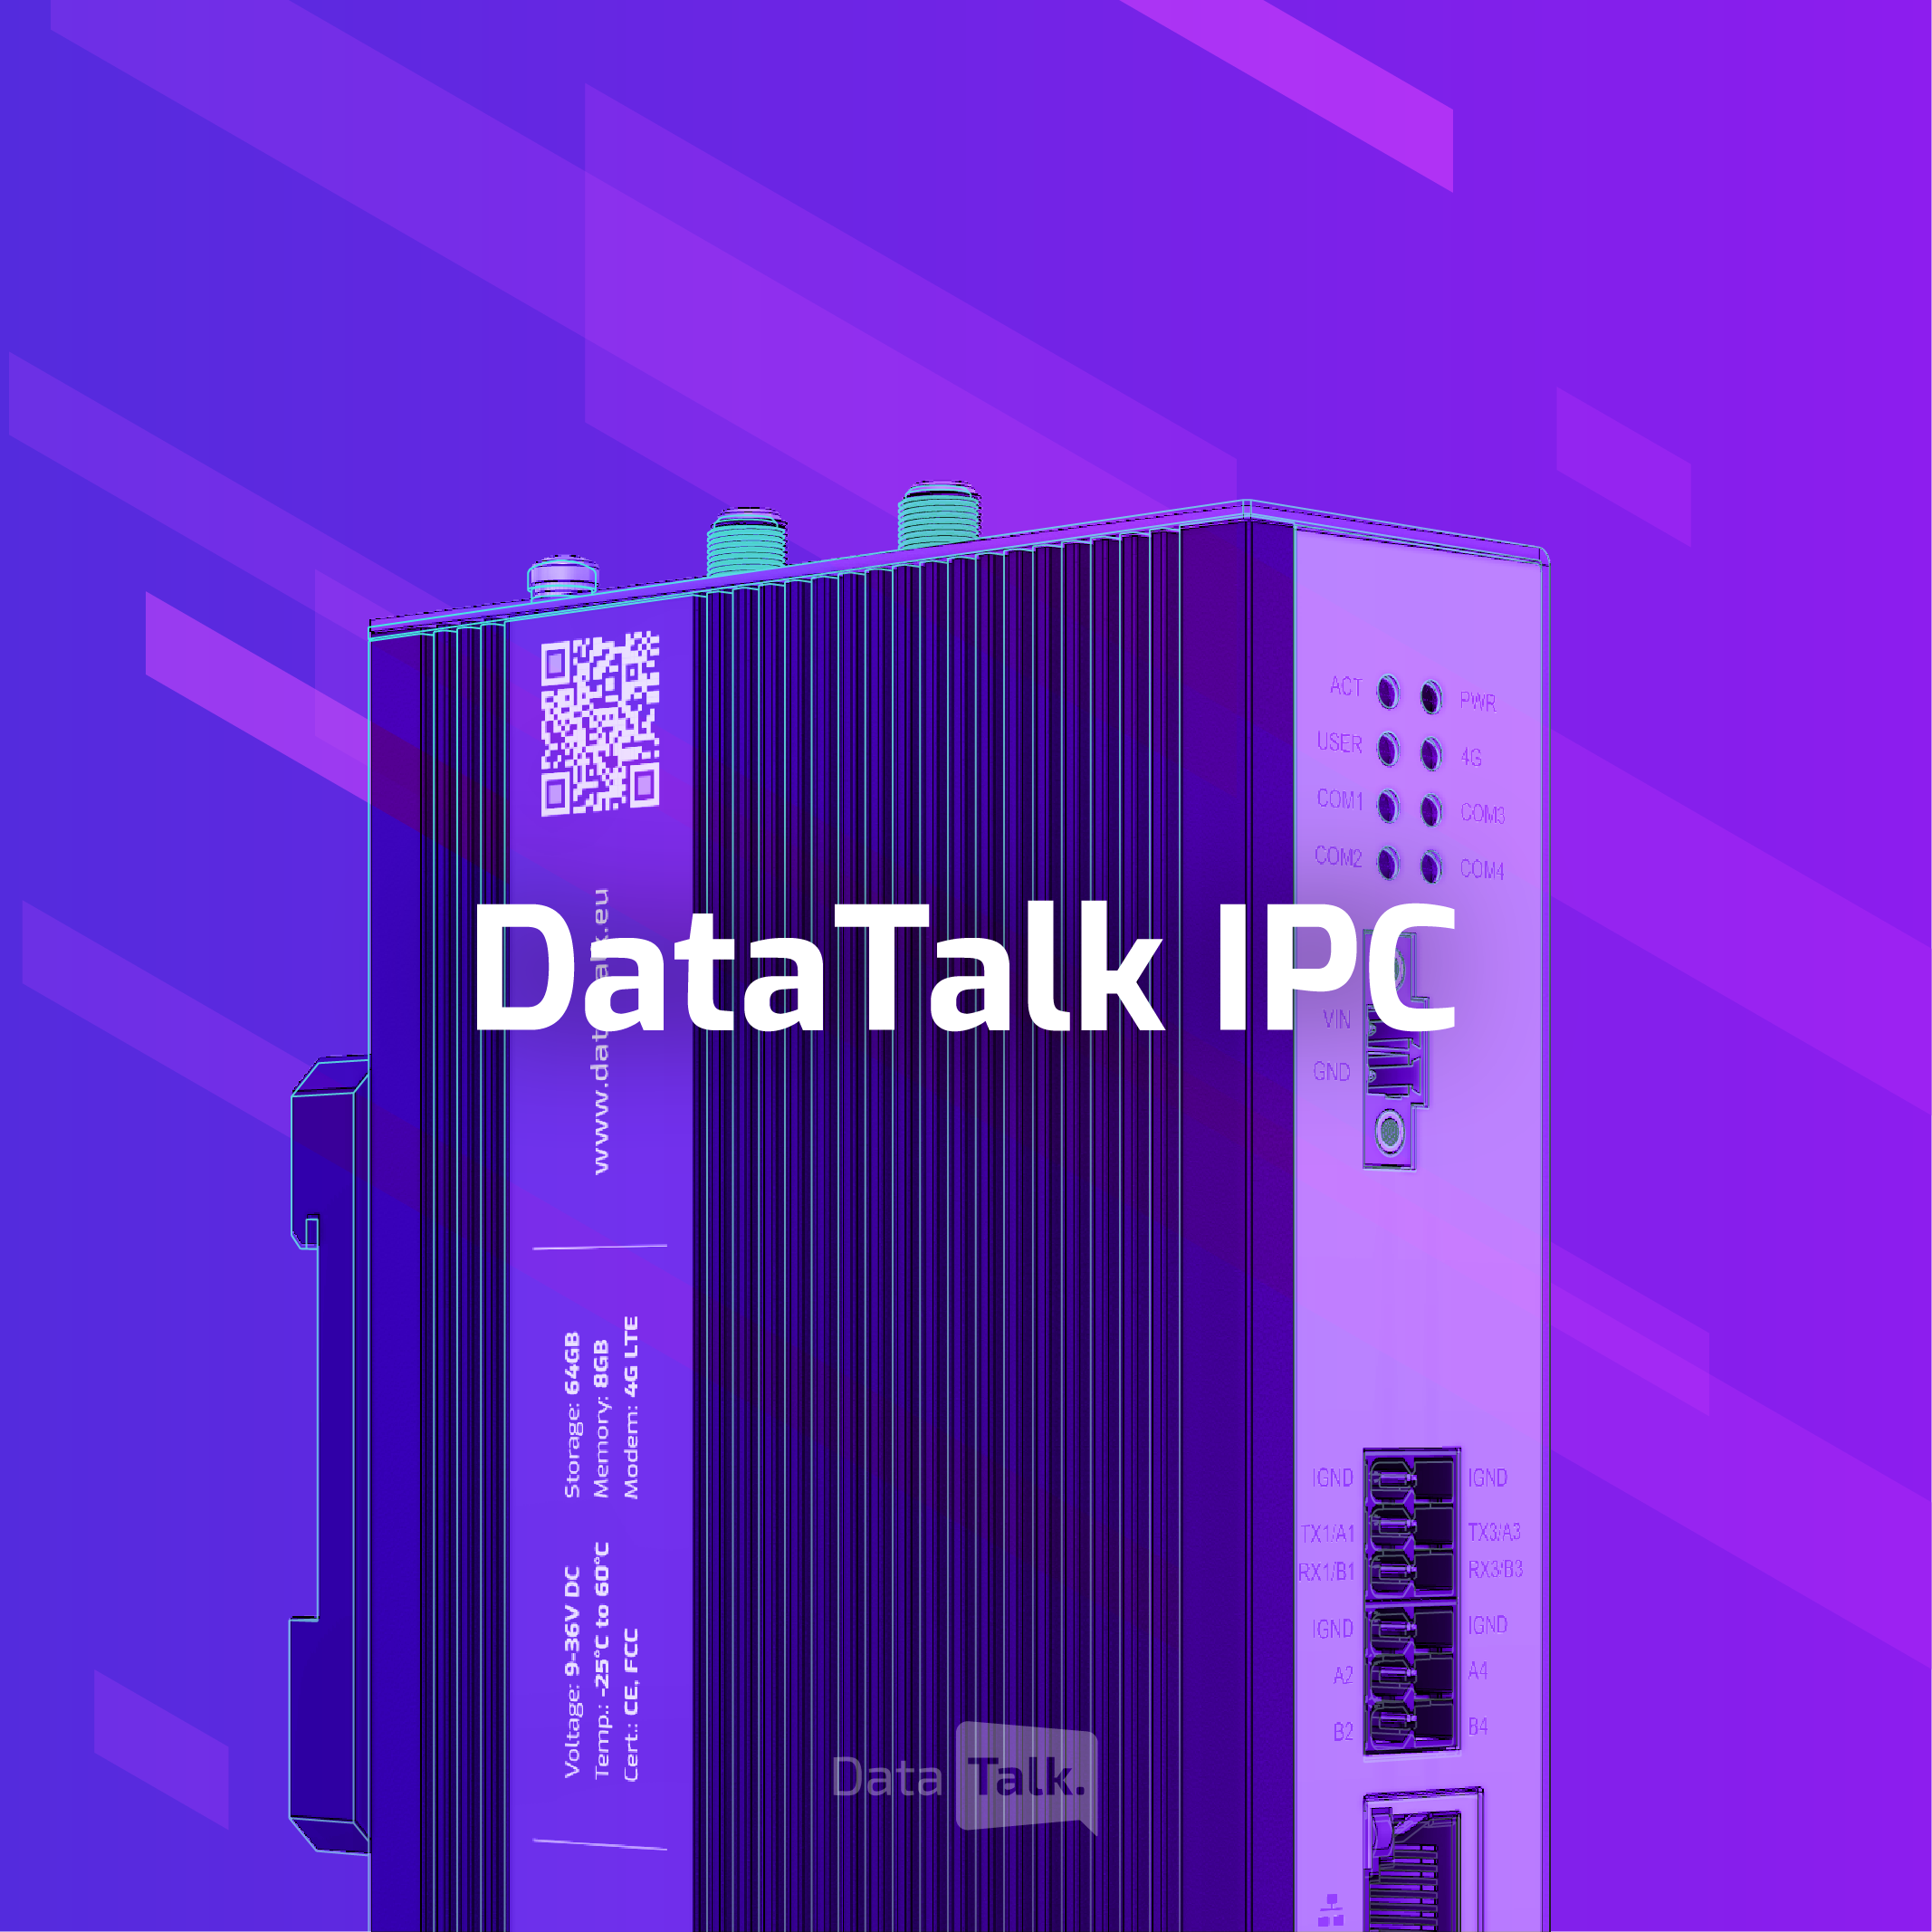
DataTalk IPC
Run DataTalk software directly at the edge-right next to your PLC, on your machine, or along your production line. Designed specifically for industrial environments, DataTalk IPC delivers reliable, 24/7 operation without compromise.
Trusted by:


Blog
DataTalk Blog
Stay up-to-date with DataTalk’s new functions, references, and use cases posted on our website’s News.
-

DataTalk version 1.5.0 is here
We are excited to announce that DataTalk runtime 1.5.0 is released now!
·
-
Real-time Dashboards released
Prague, Czechia – October 13, 2026 – DataTalk is proud to announce the launch of its Real-time Dashboards. It is…
·
-
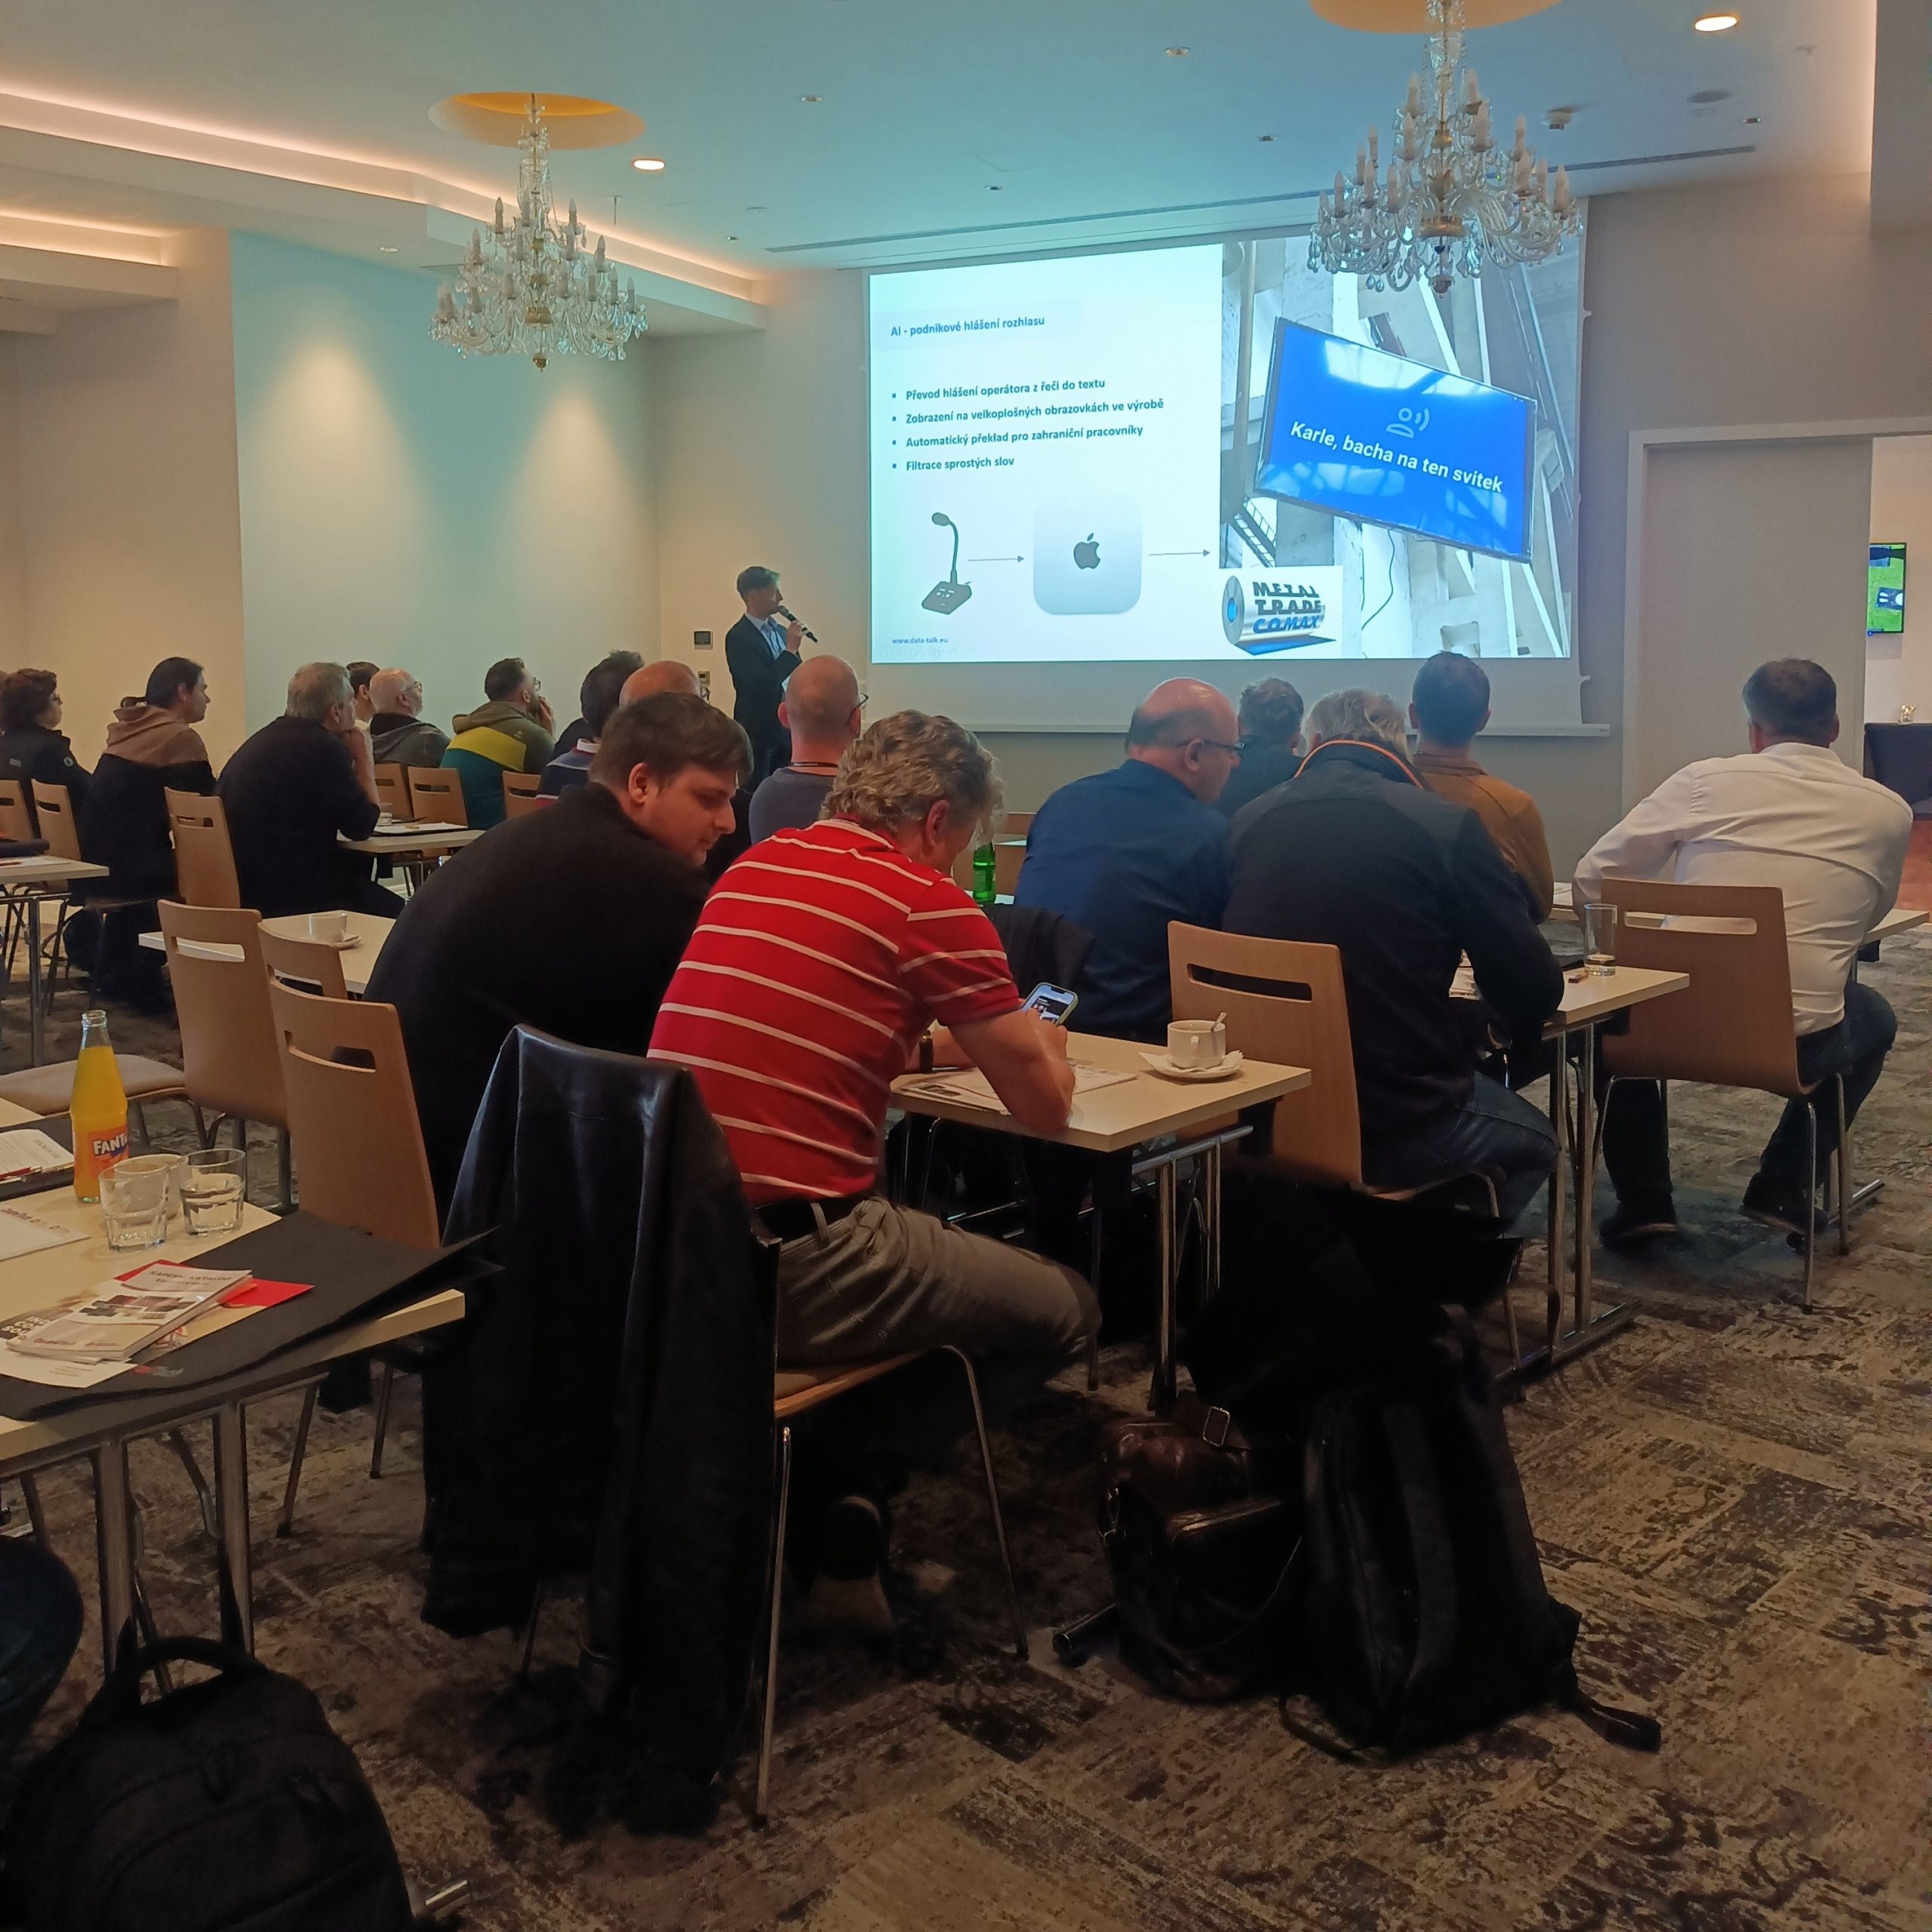
2026: Real-World AI Projects, and Practical Impact
Throughout 2026, we had the opportunity to participate in several industry events together with our partners ControlTech and Rockwell Automation,…
·
Subscribe us!
Get in touch
Your feedback matters
Whether it’s a question, suggestion, or compliment, we’re here to listen. Reach out via contact form. We’ll get back to you promptly.
office
Czech Republic
Velvarská 1699/29
Prague
Czech Republic
office
Germany
Marktplatz 6
Thierstein
Germany
I have read and agree to the Privacy Policy.


Connect, Log & Report
From the Shop Floor to the Top Floor
Don’t Overthink it
Download now and be amazed! It’s completely free and quick.
BlOG
News from Industrial Automation
Read the latest info
01

AI Module in DataTalk: Industrial Automation
The AI module within DataTalk utilizes a Large Language Model (LLM) to perform advanced data analysis and provide intelligent system insights for industrial processes. This helps users gain a deeper understanding of their equipment’s performance, identify patterns, and troubleshoot issues more effectively.
02

AI Module in DataTalk: Cloud or On-Premises Options
The AI module in DataTalk is designed to work in two flexible configurations, tailored to meet your specific needs: a cloud-based AI LLM solution or a fully on-premises setup. Each option offers distinct benefits, so you can choose the one that best suits your requirements.
Trusted by:
What does the term AI mean for us?
AI is a broad term that includes machine learning, machine vision, and large language models (LLM). Machine learning allows systems to learn from data, while machine vision gives machines the ability to “see” and evaluate their surroundings. LLMs add natural-language understanding so machines can interpret questions and provide helpful answers.
BlOG
News from Industrial Automation