
Press release
DataTalk Launches Real-time Dashboards: Simplifying Industrial Data Visualization
Prague, Czechia – October 13, 2026 – DataTalk is proud to announce the launch of its Real-time Dashboards. It is an all-in-one industrial visualization solution designed to turn production data into clear, interactive, and actionable insights. The solution enables manufacturers to connect directly to PLCs, IIoT sensors, MQTT, databases, and other industrial data sources, visualize live and historical data, and create custom dashboards without coding.
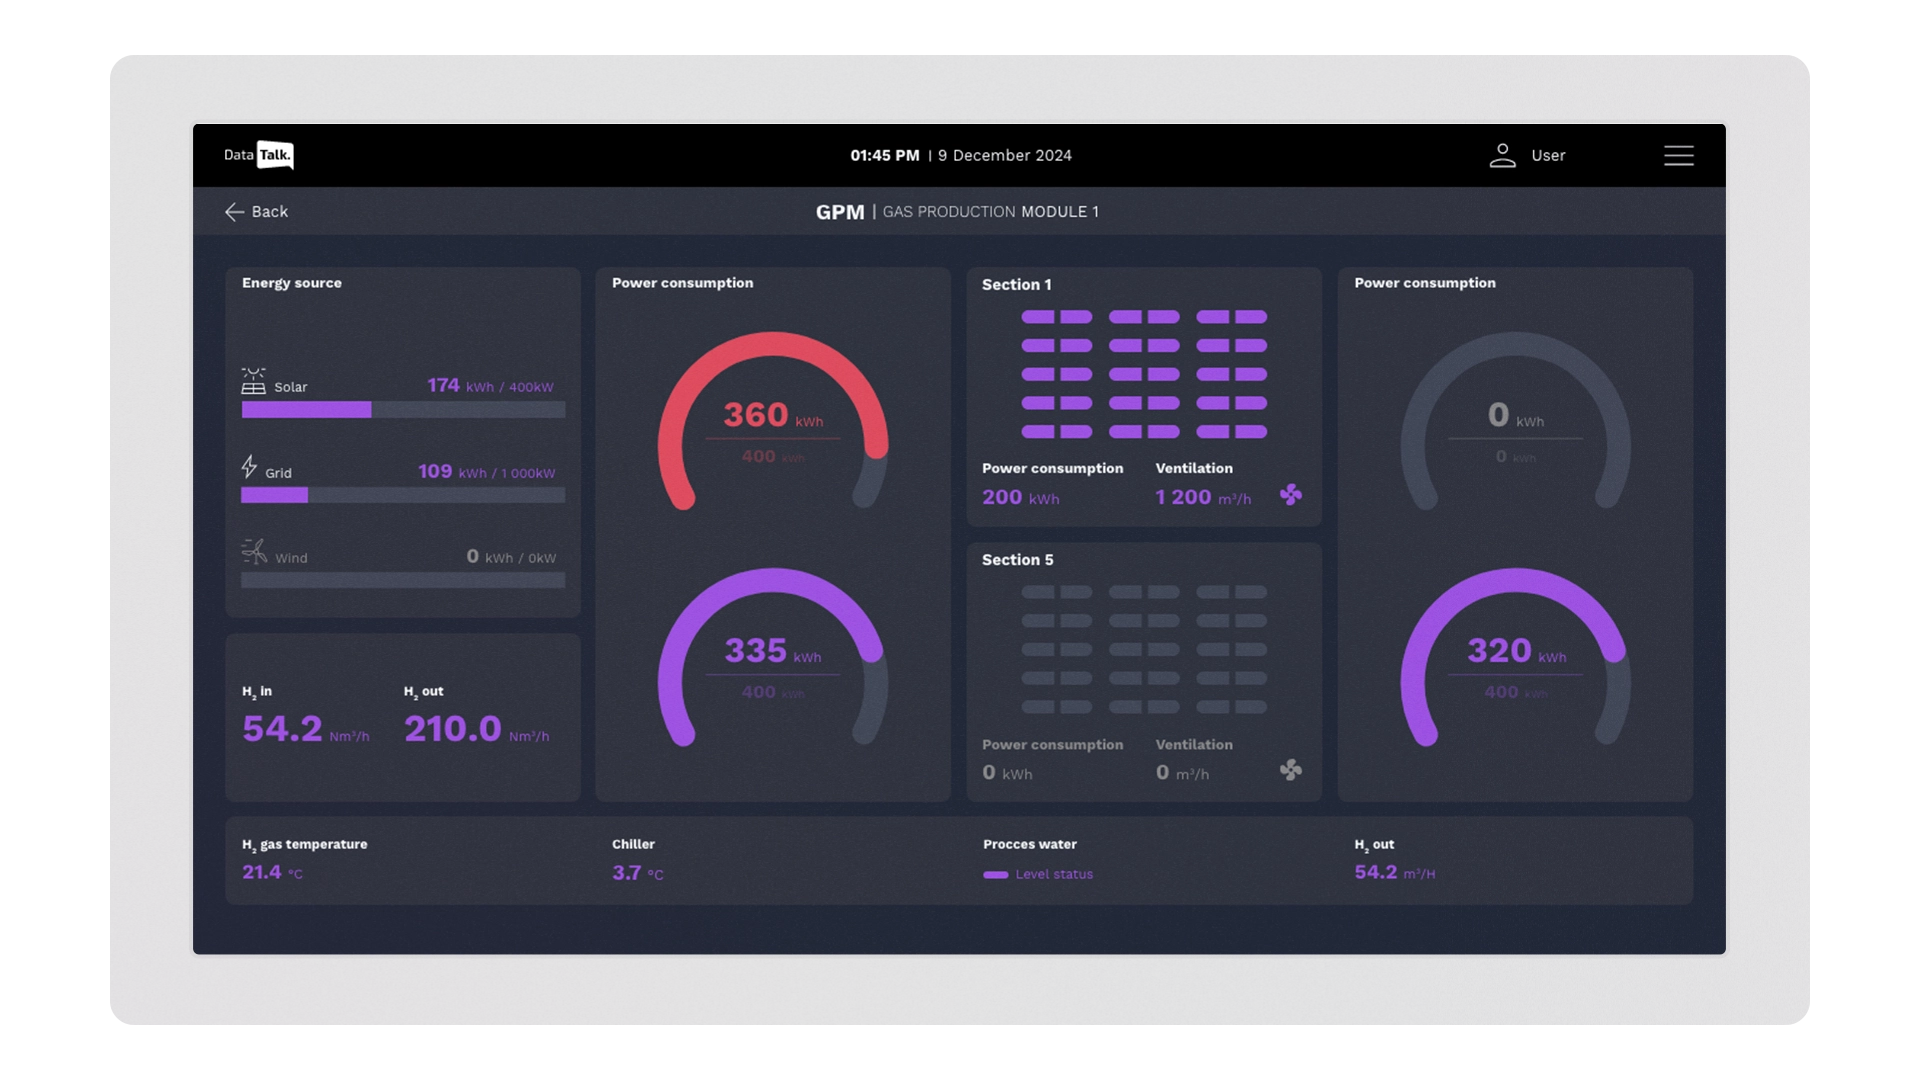
Key Features:
- Direct Industrial Connectivity: Connect directly to PLCs, IIoT sensors, and other industrial devices using built-in support for OPC UA, Modbus TCP, MQTT, and EtherNet/IP.
- Integrated Data Acquisition & Historian: Collect live production data and store it in an integrated time-series database (Historian). Trends, historical analysis, reporting, and performance monitoring have never been easier.
- No-Code Dashboard Creation: Build custom dashboards quickly using an intuitive Drag & Drop interface, without programming or SQL knowledge.
- Extensive Visualization Library: Create interactive visualizations using 250+ ready-to-use graphics, 500+ P&ID symbols, and 1,200+ integrated Google icons. Custom graphical assets can also be created using the integrated visual editor.
- Live & Historical Data: Combine real-time and historical data in the same dashboard to provide a complete view of machines, production lines, processes, and equipment.
- All-in-One Solution: Combine data acquisition, processing, data logging, and visualization in a single platform, eliminating the need to build and maintain a solution from multiple independent components.
- Secure On-Premise Deployment: Keep critical industrial data under your control with an on-premise solution that can run on Windows, Linux, or Docker environments.
Use Cases:
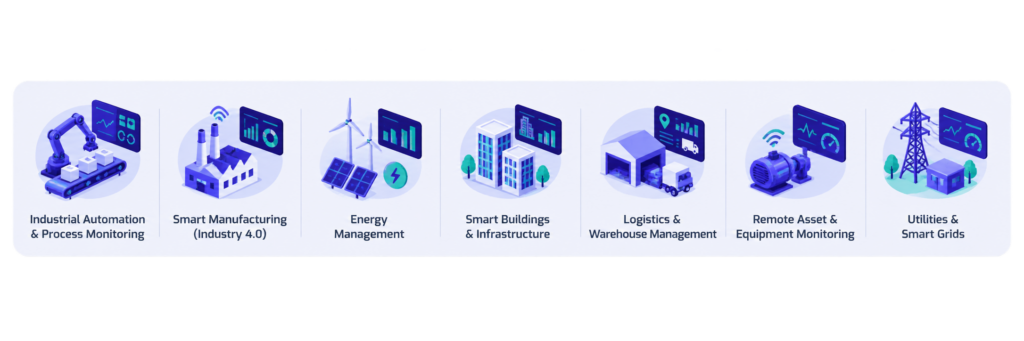
- Industrial Automation & Process Monitoring: Monitor machines, production lines, and industrial processes in real time.
- Smart Manufacturing (Industry 4.0): Turn connected machine data into actionable production insights and support data-driven decision making.
- Energy Management: Monitor energy consumption and visualize energy data across production facilities.
- Smart Buildings & Infrastructure: Visualize and monitor building systems, infrastructure, and connected devices.
- Logistics & Warehouse Management: Track and visualize warehouse operations, material flows, and connected equipment.
- Remote Asset & Equipment Monitoring: Monitor the performance and status of industrial equipment from remote locations.
- Utilities & Smart Grids: Monitor distributed infrastructure and visualize operational data from connected assets.
DataTalk Real-time Dashboards bring data acquisition, processing, historical storage, and industrial visualization together in one no-code solution, making it easier for manufacturers to connect their machines, understand their production data, and act on it in real time.
Leave a Reply