
Web HMI
BUILD HMIs iN hOURS, nOT wEEKS. GROW wITHOUT lIMITS.
A web-based HMI platform with live engineering and a built-in AI Engineer — so you stop writing screens from scratch and start shipping operator interfaces at the speed your projects actually demand.
all in one
Next Generation HMI
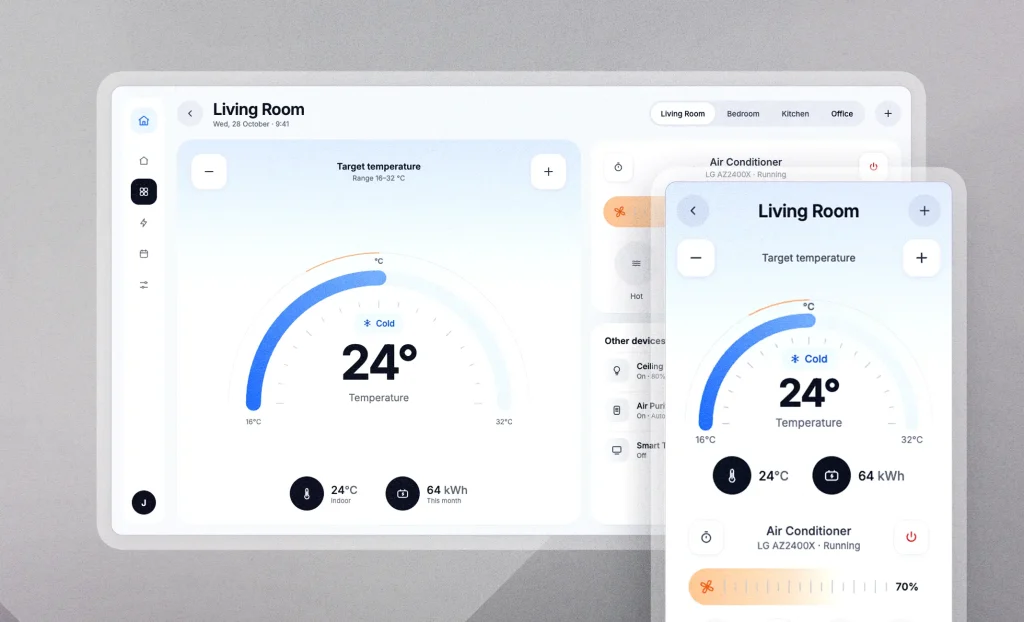
Web – based
Design, deploy, and access your HMI from any modern web browser, on any device or in our mobile app.
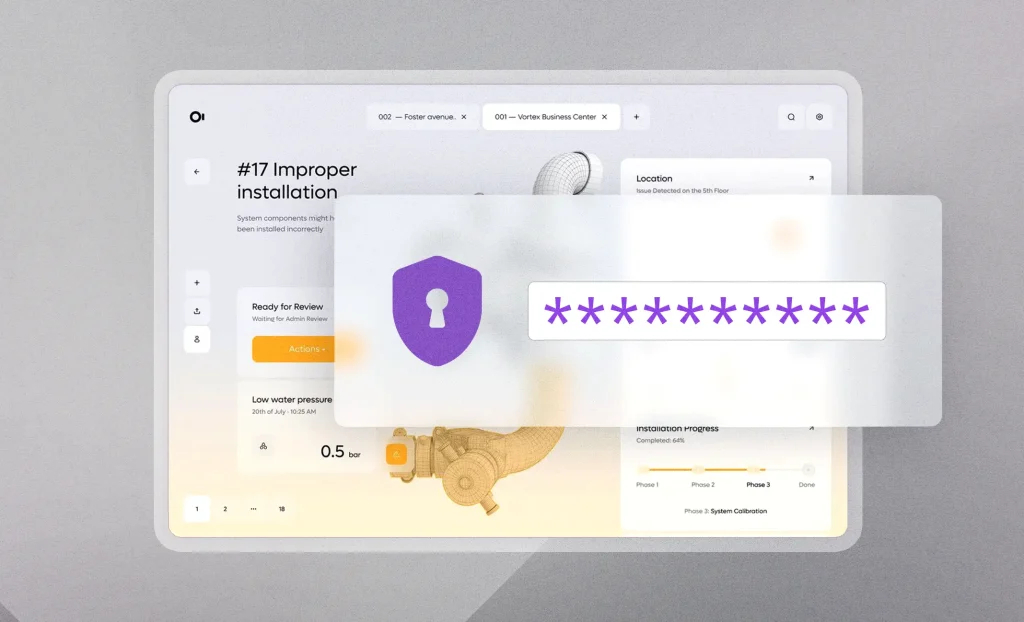
Secure by Design
Protect your industrial applications with built-in security, user access control, and secure remote access.
No Client Limits
Unlimited clients, built-in drivers, and transparent pricing with no hidden fees.
features
Everything Your Operators Need
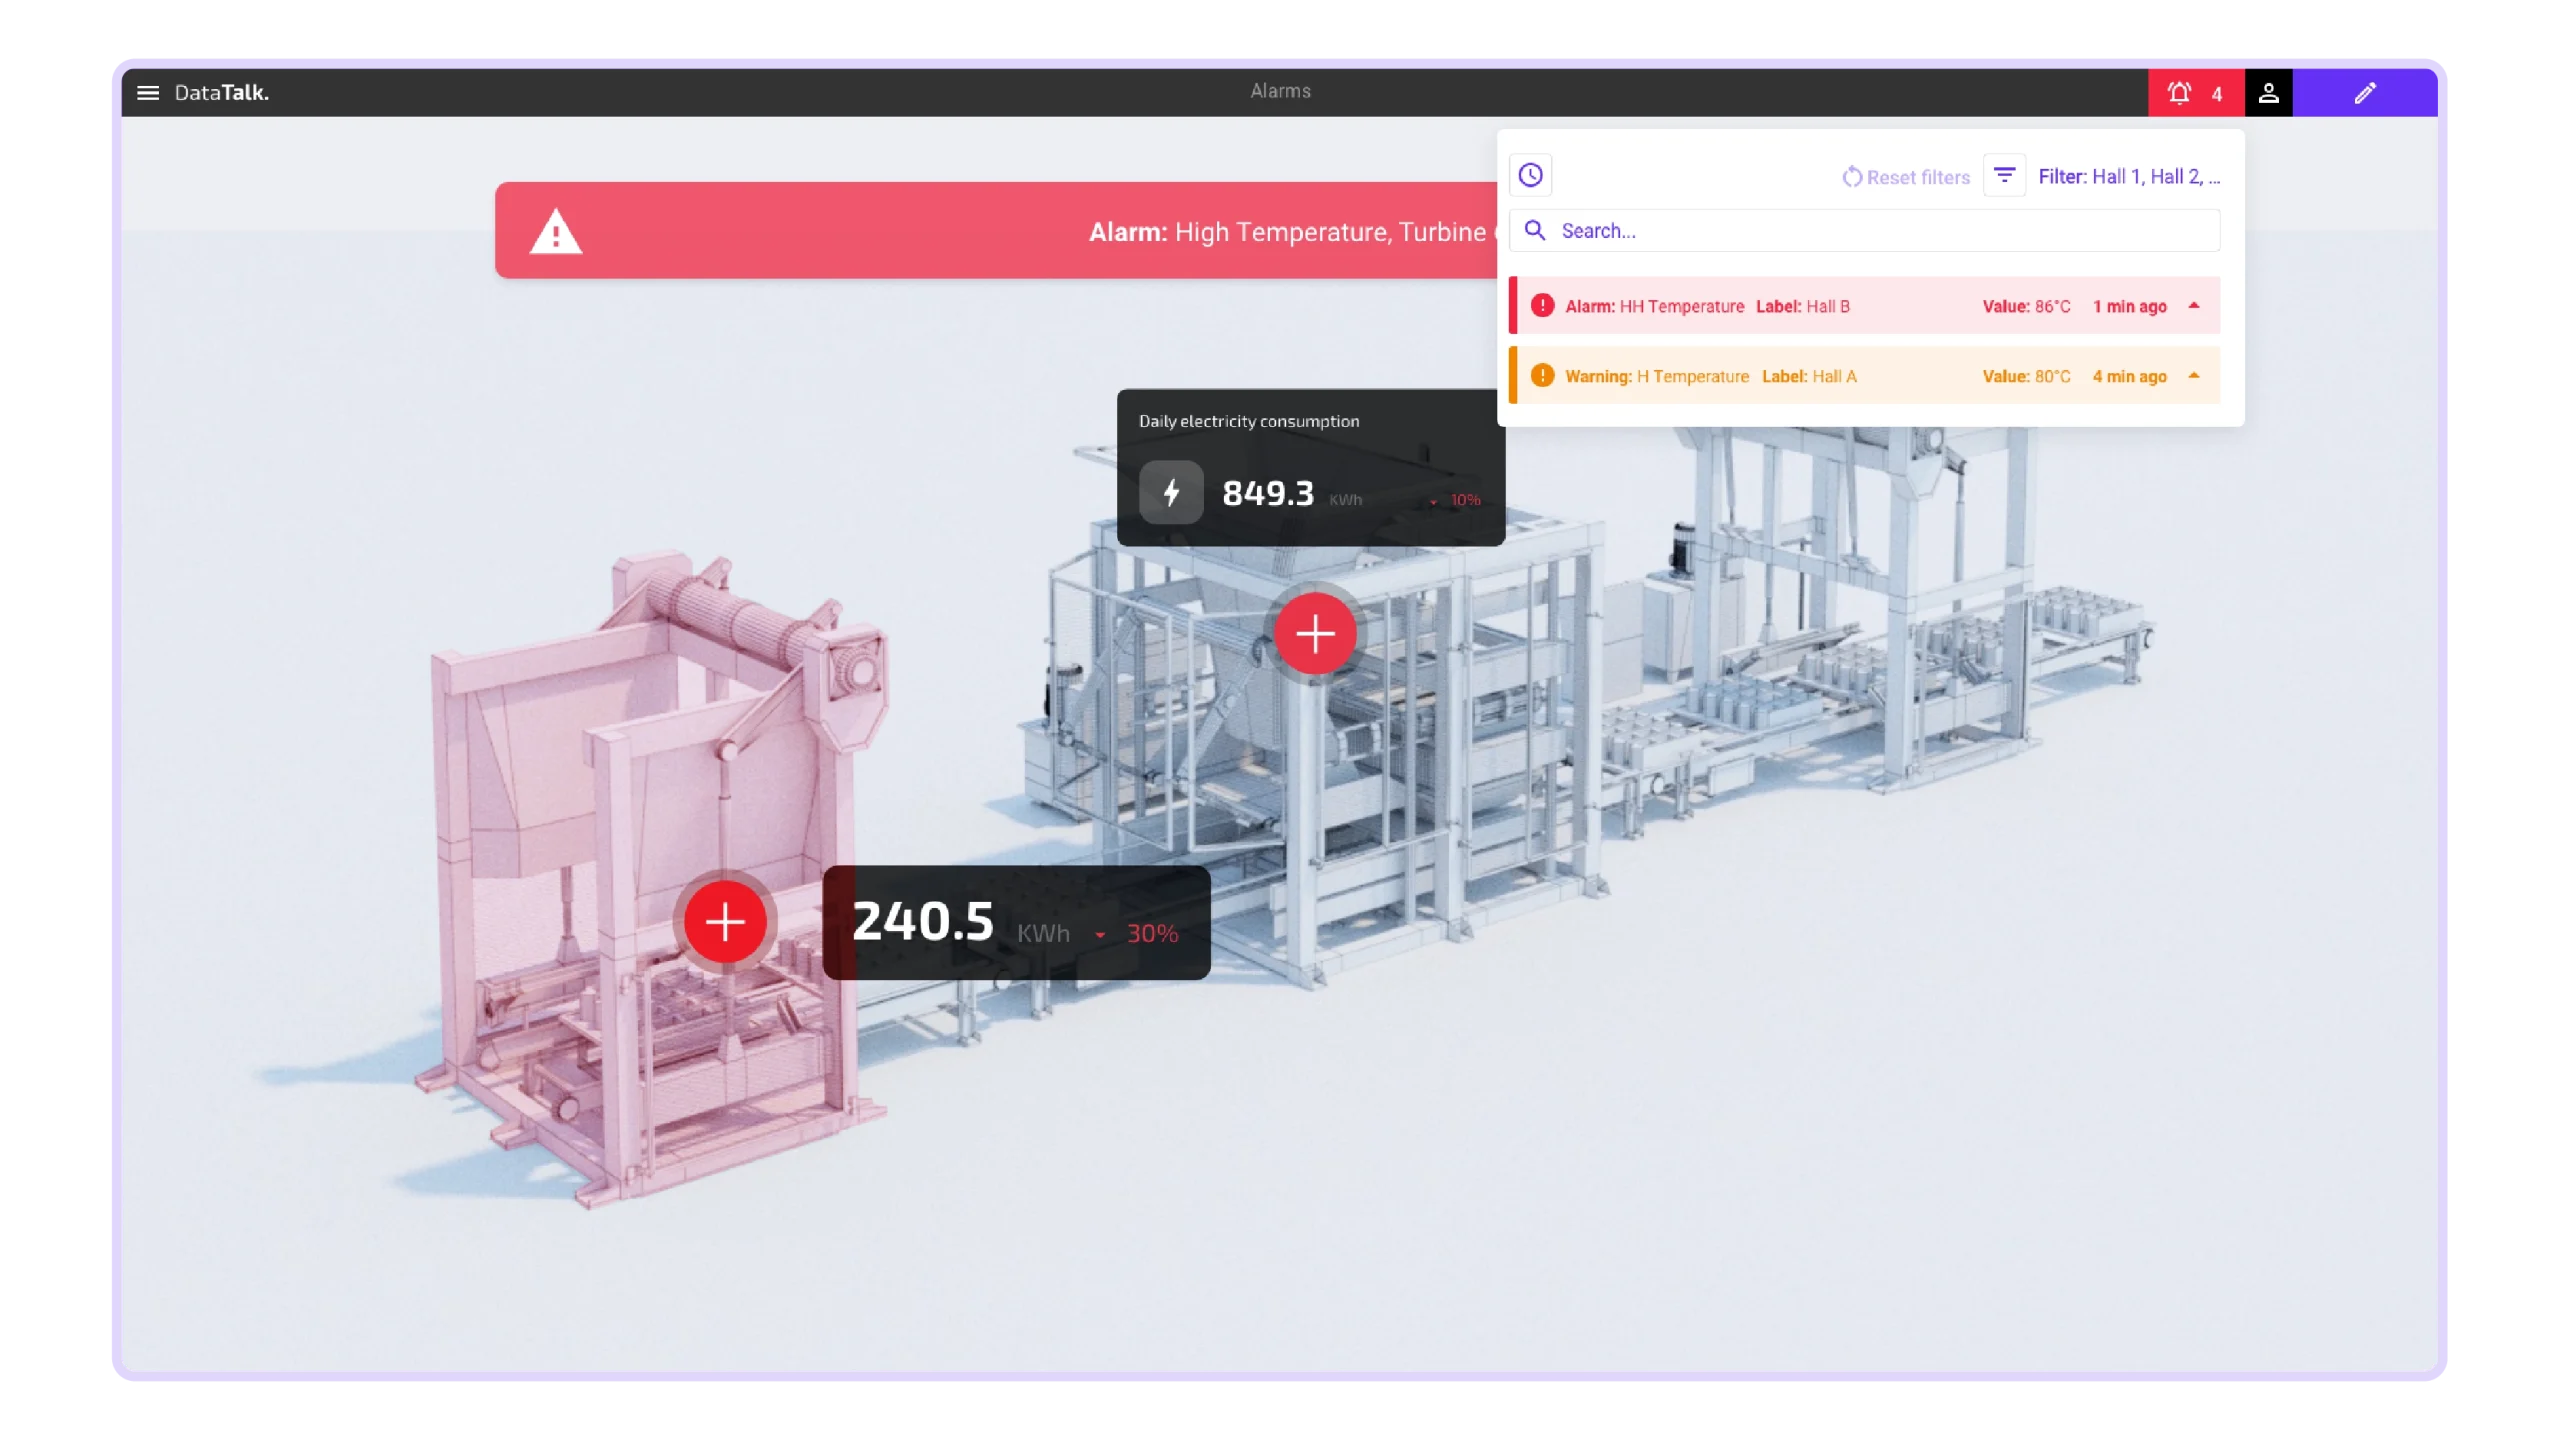
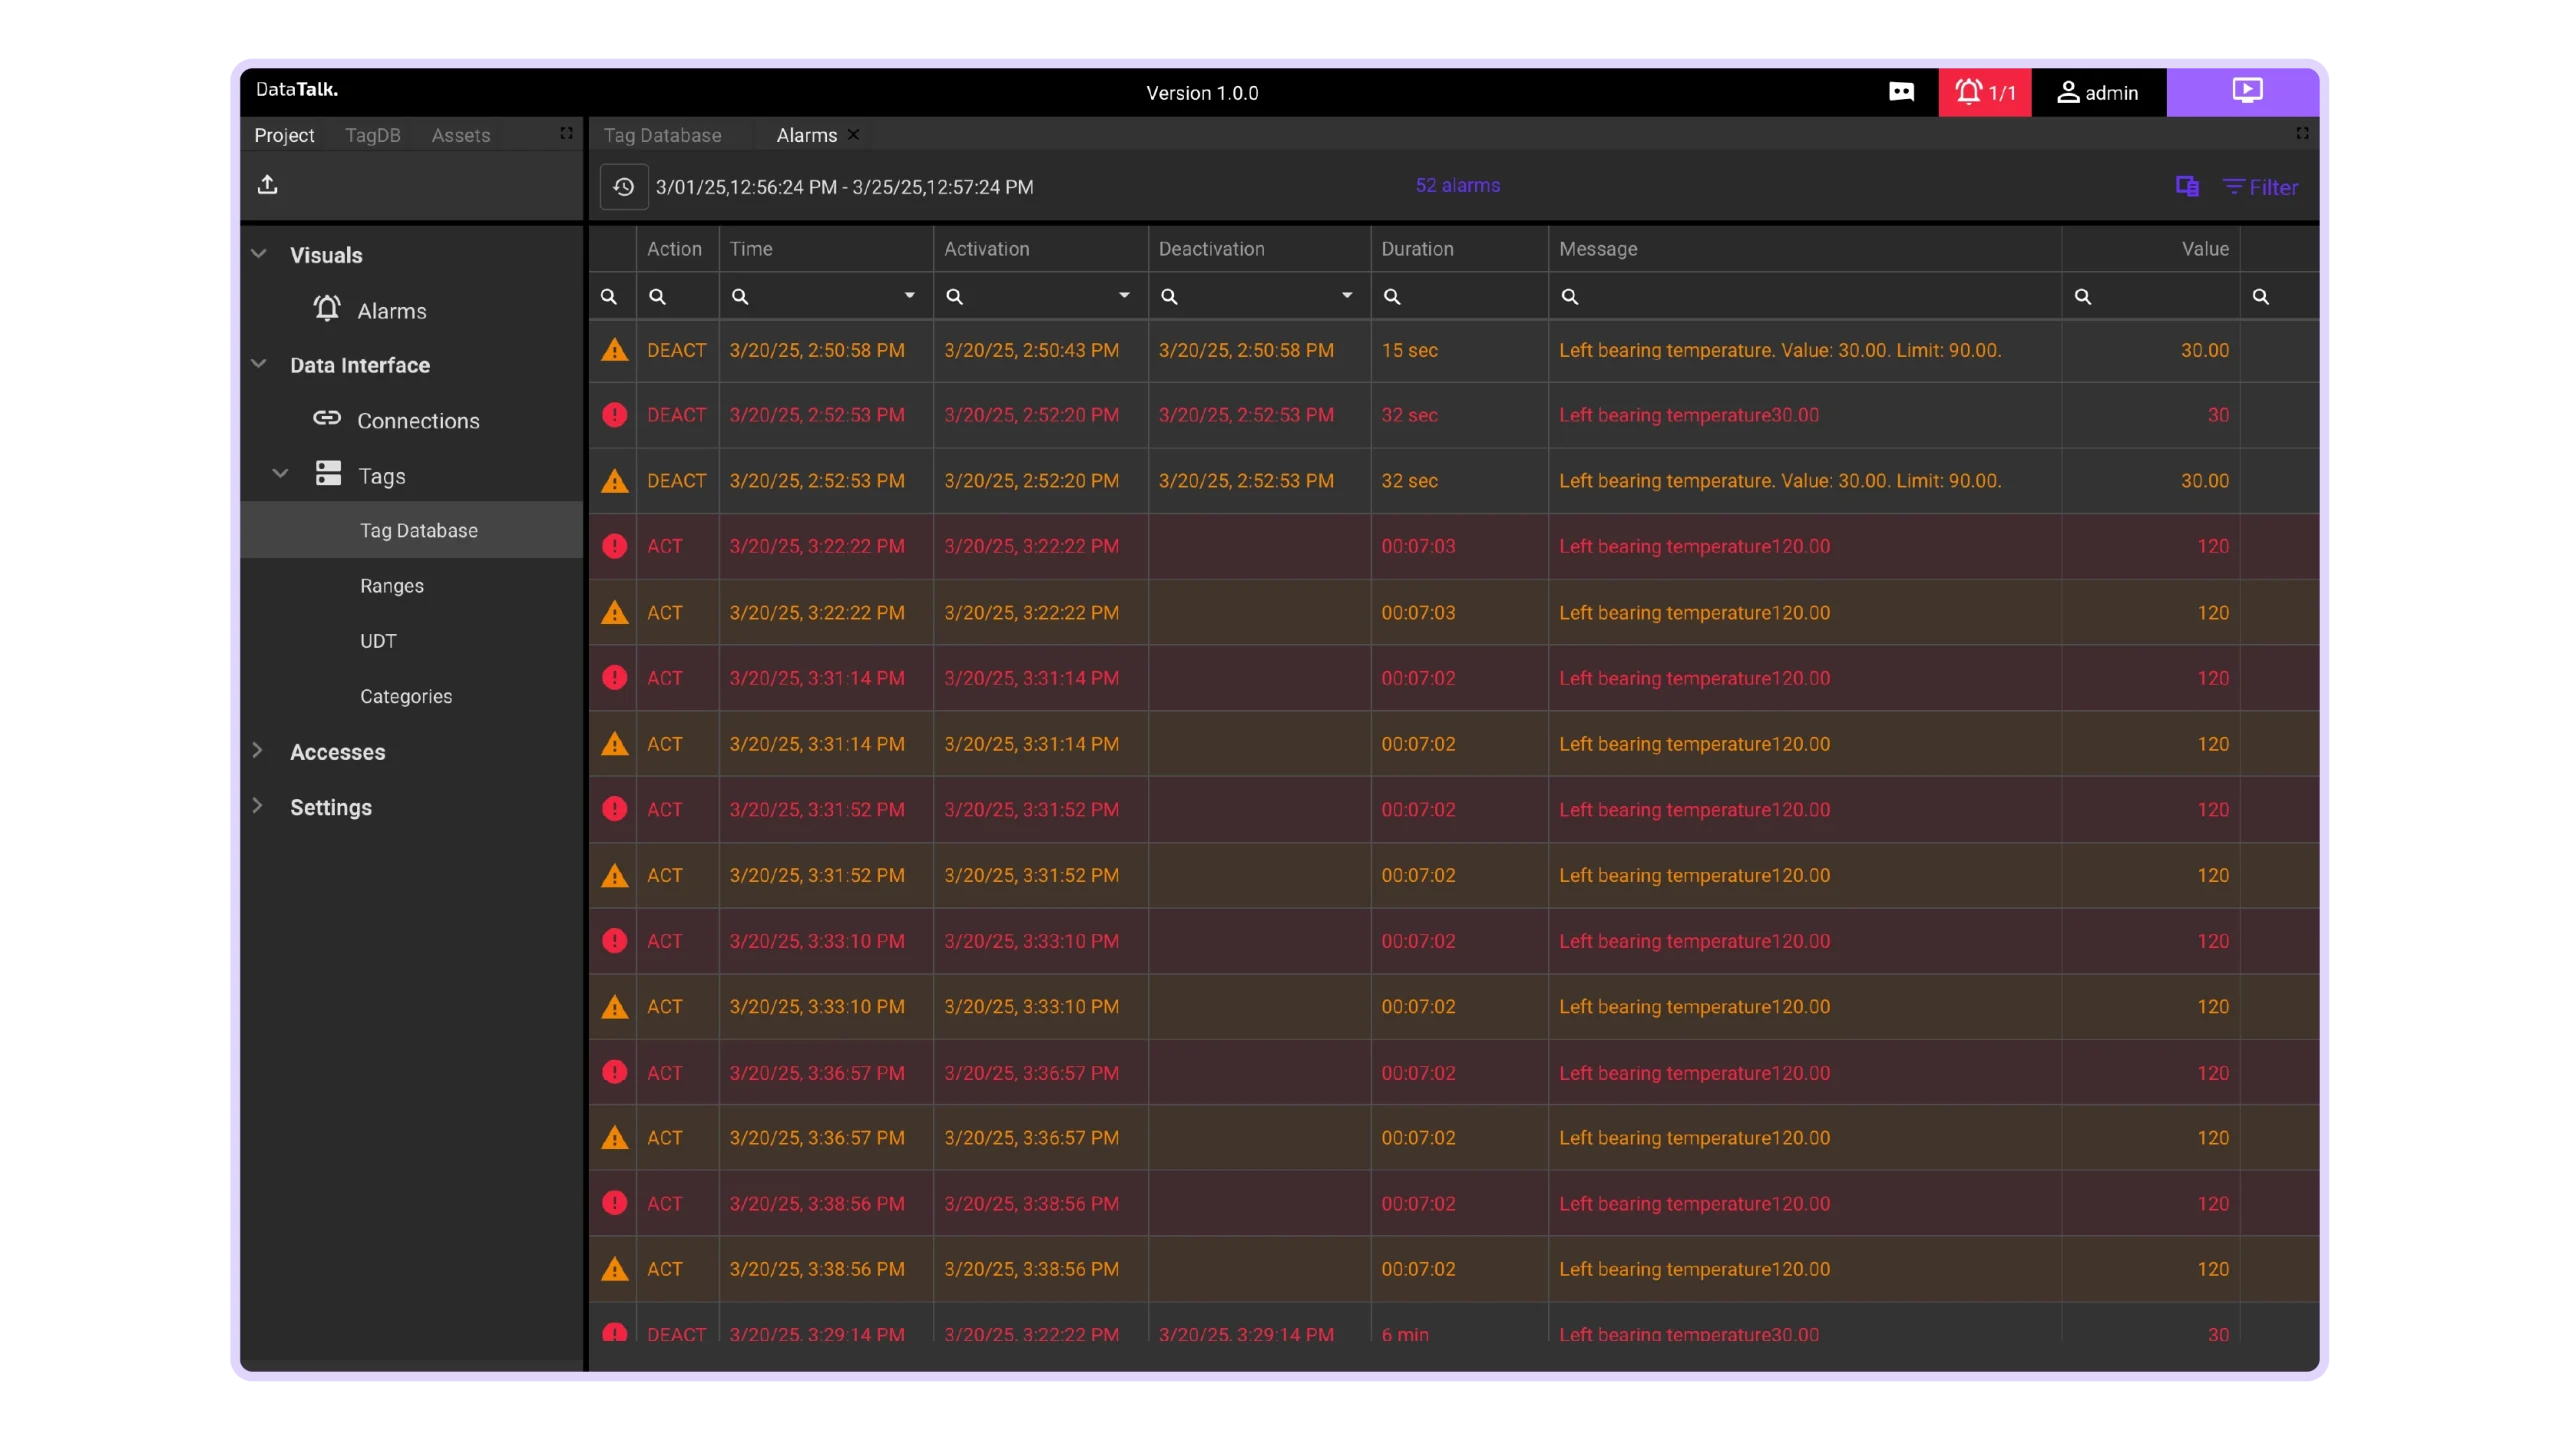
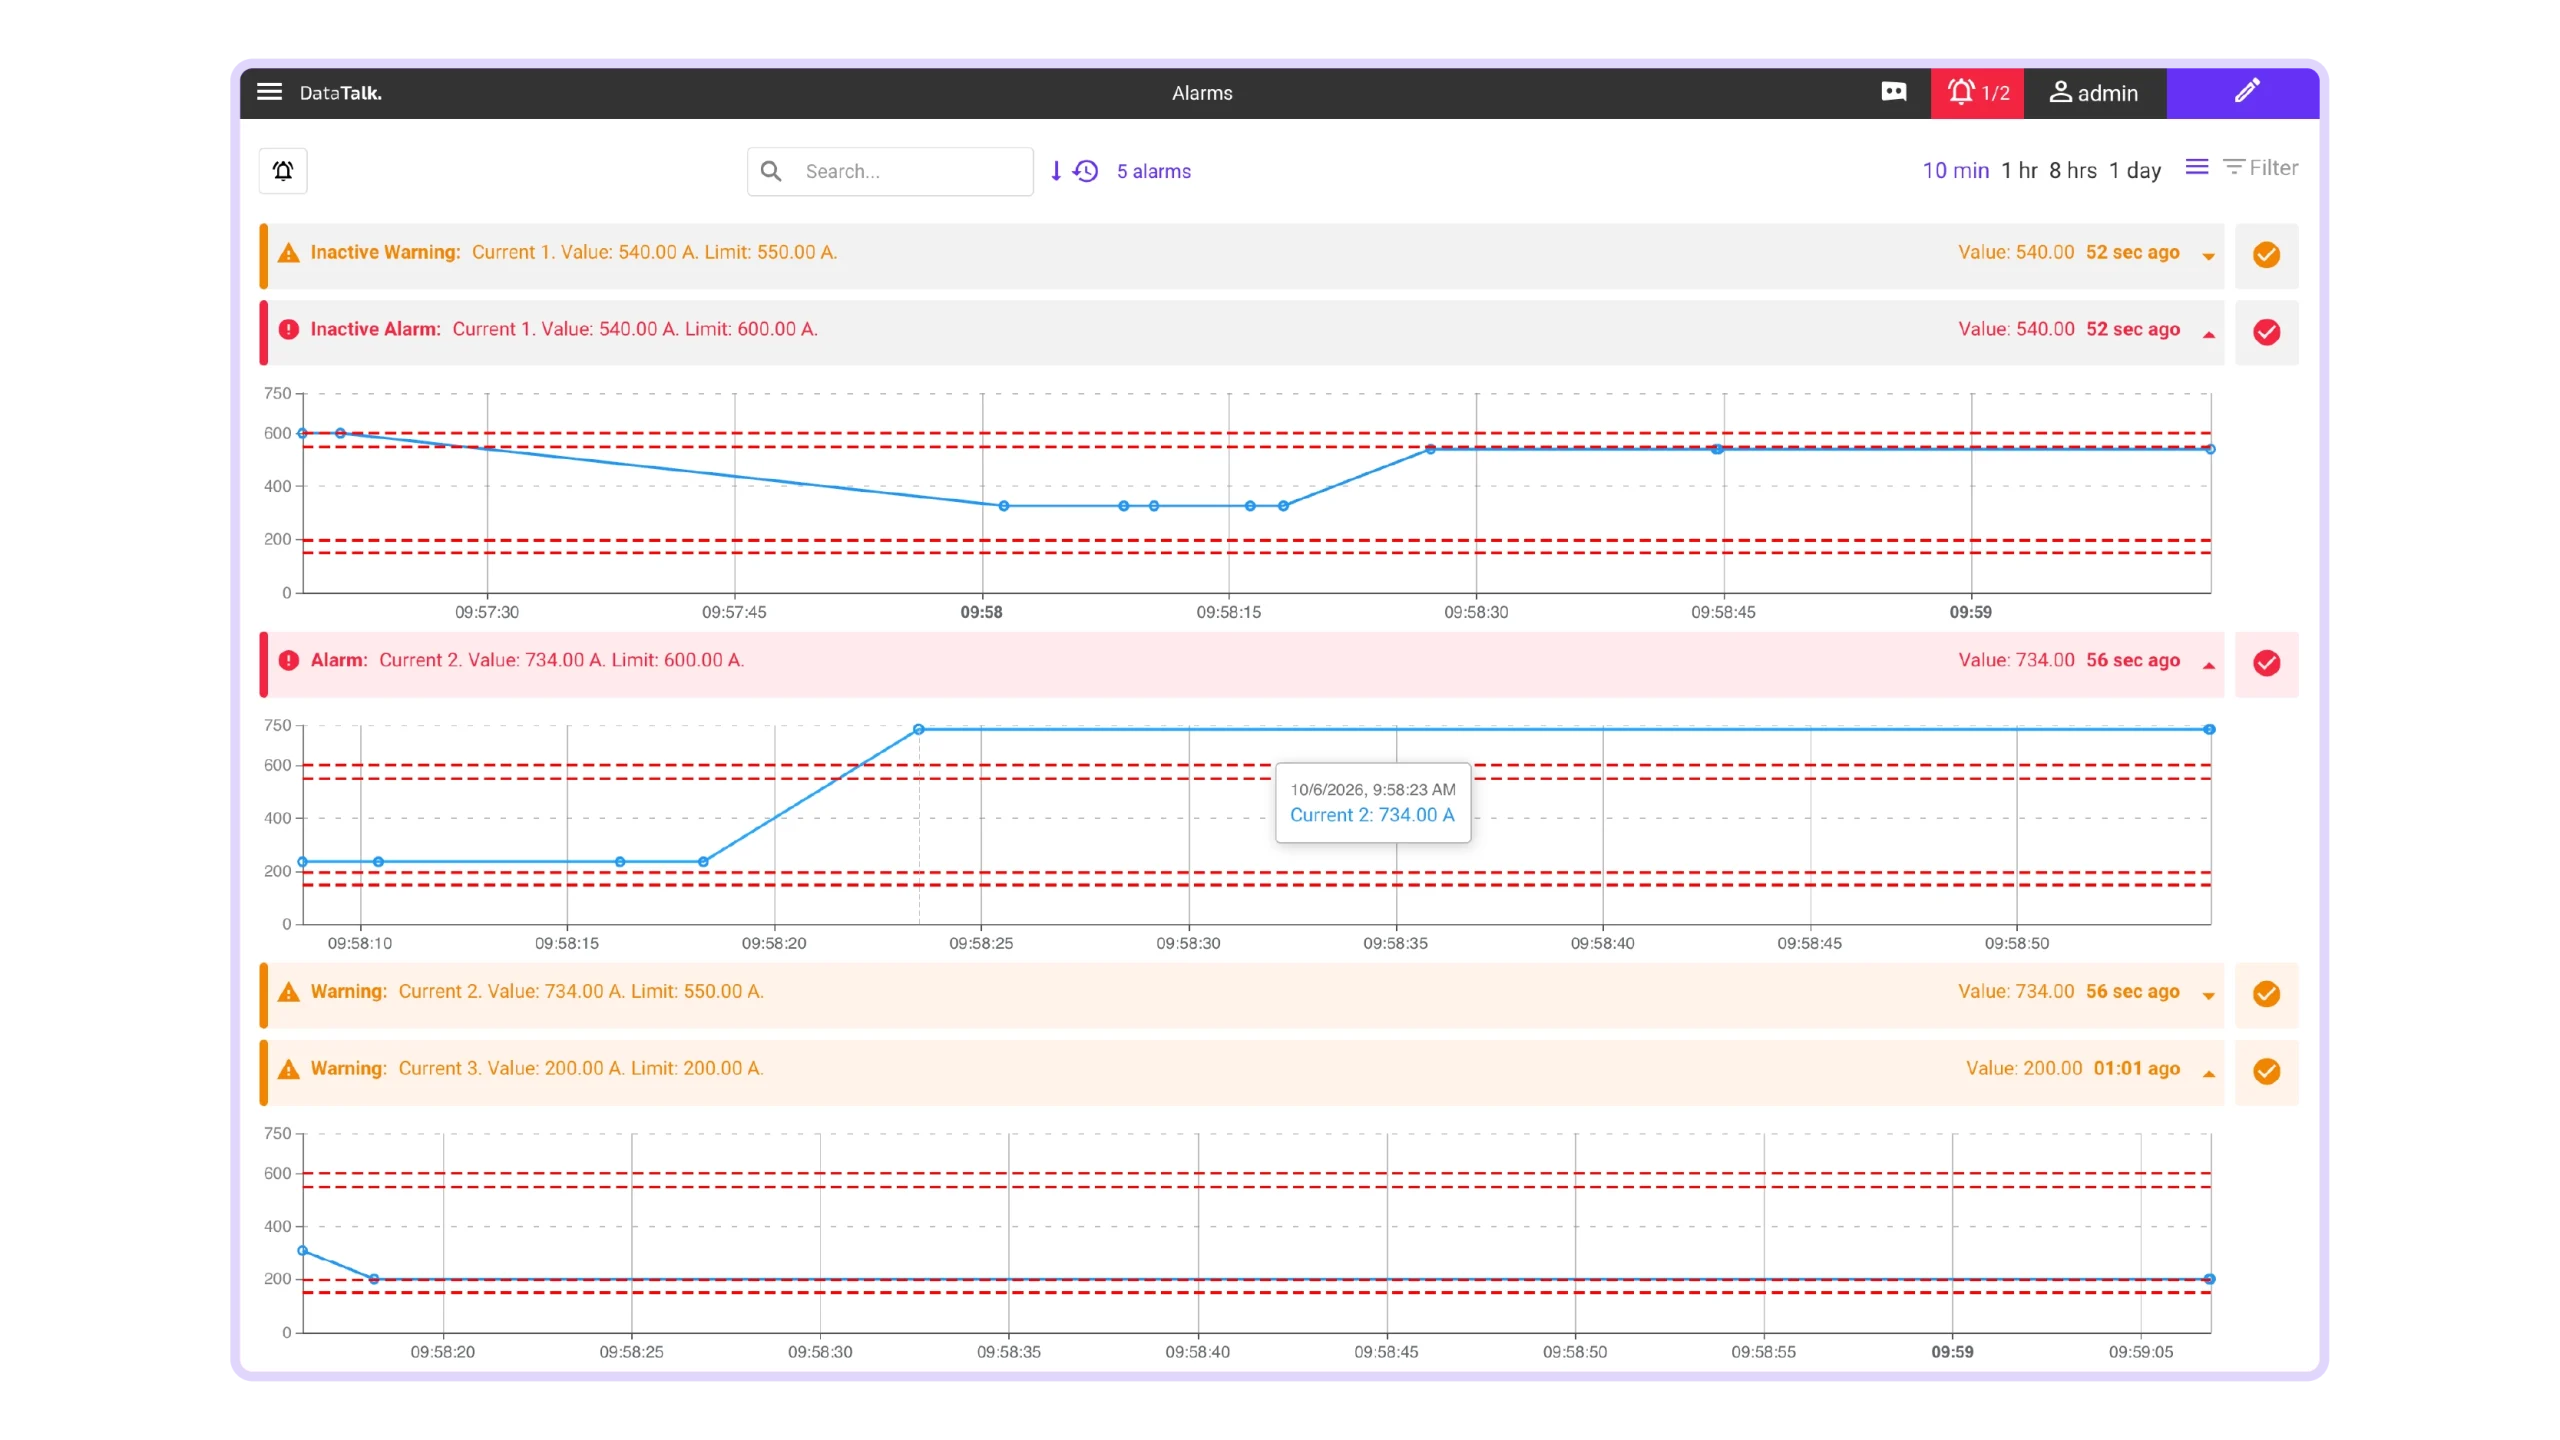
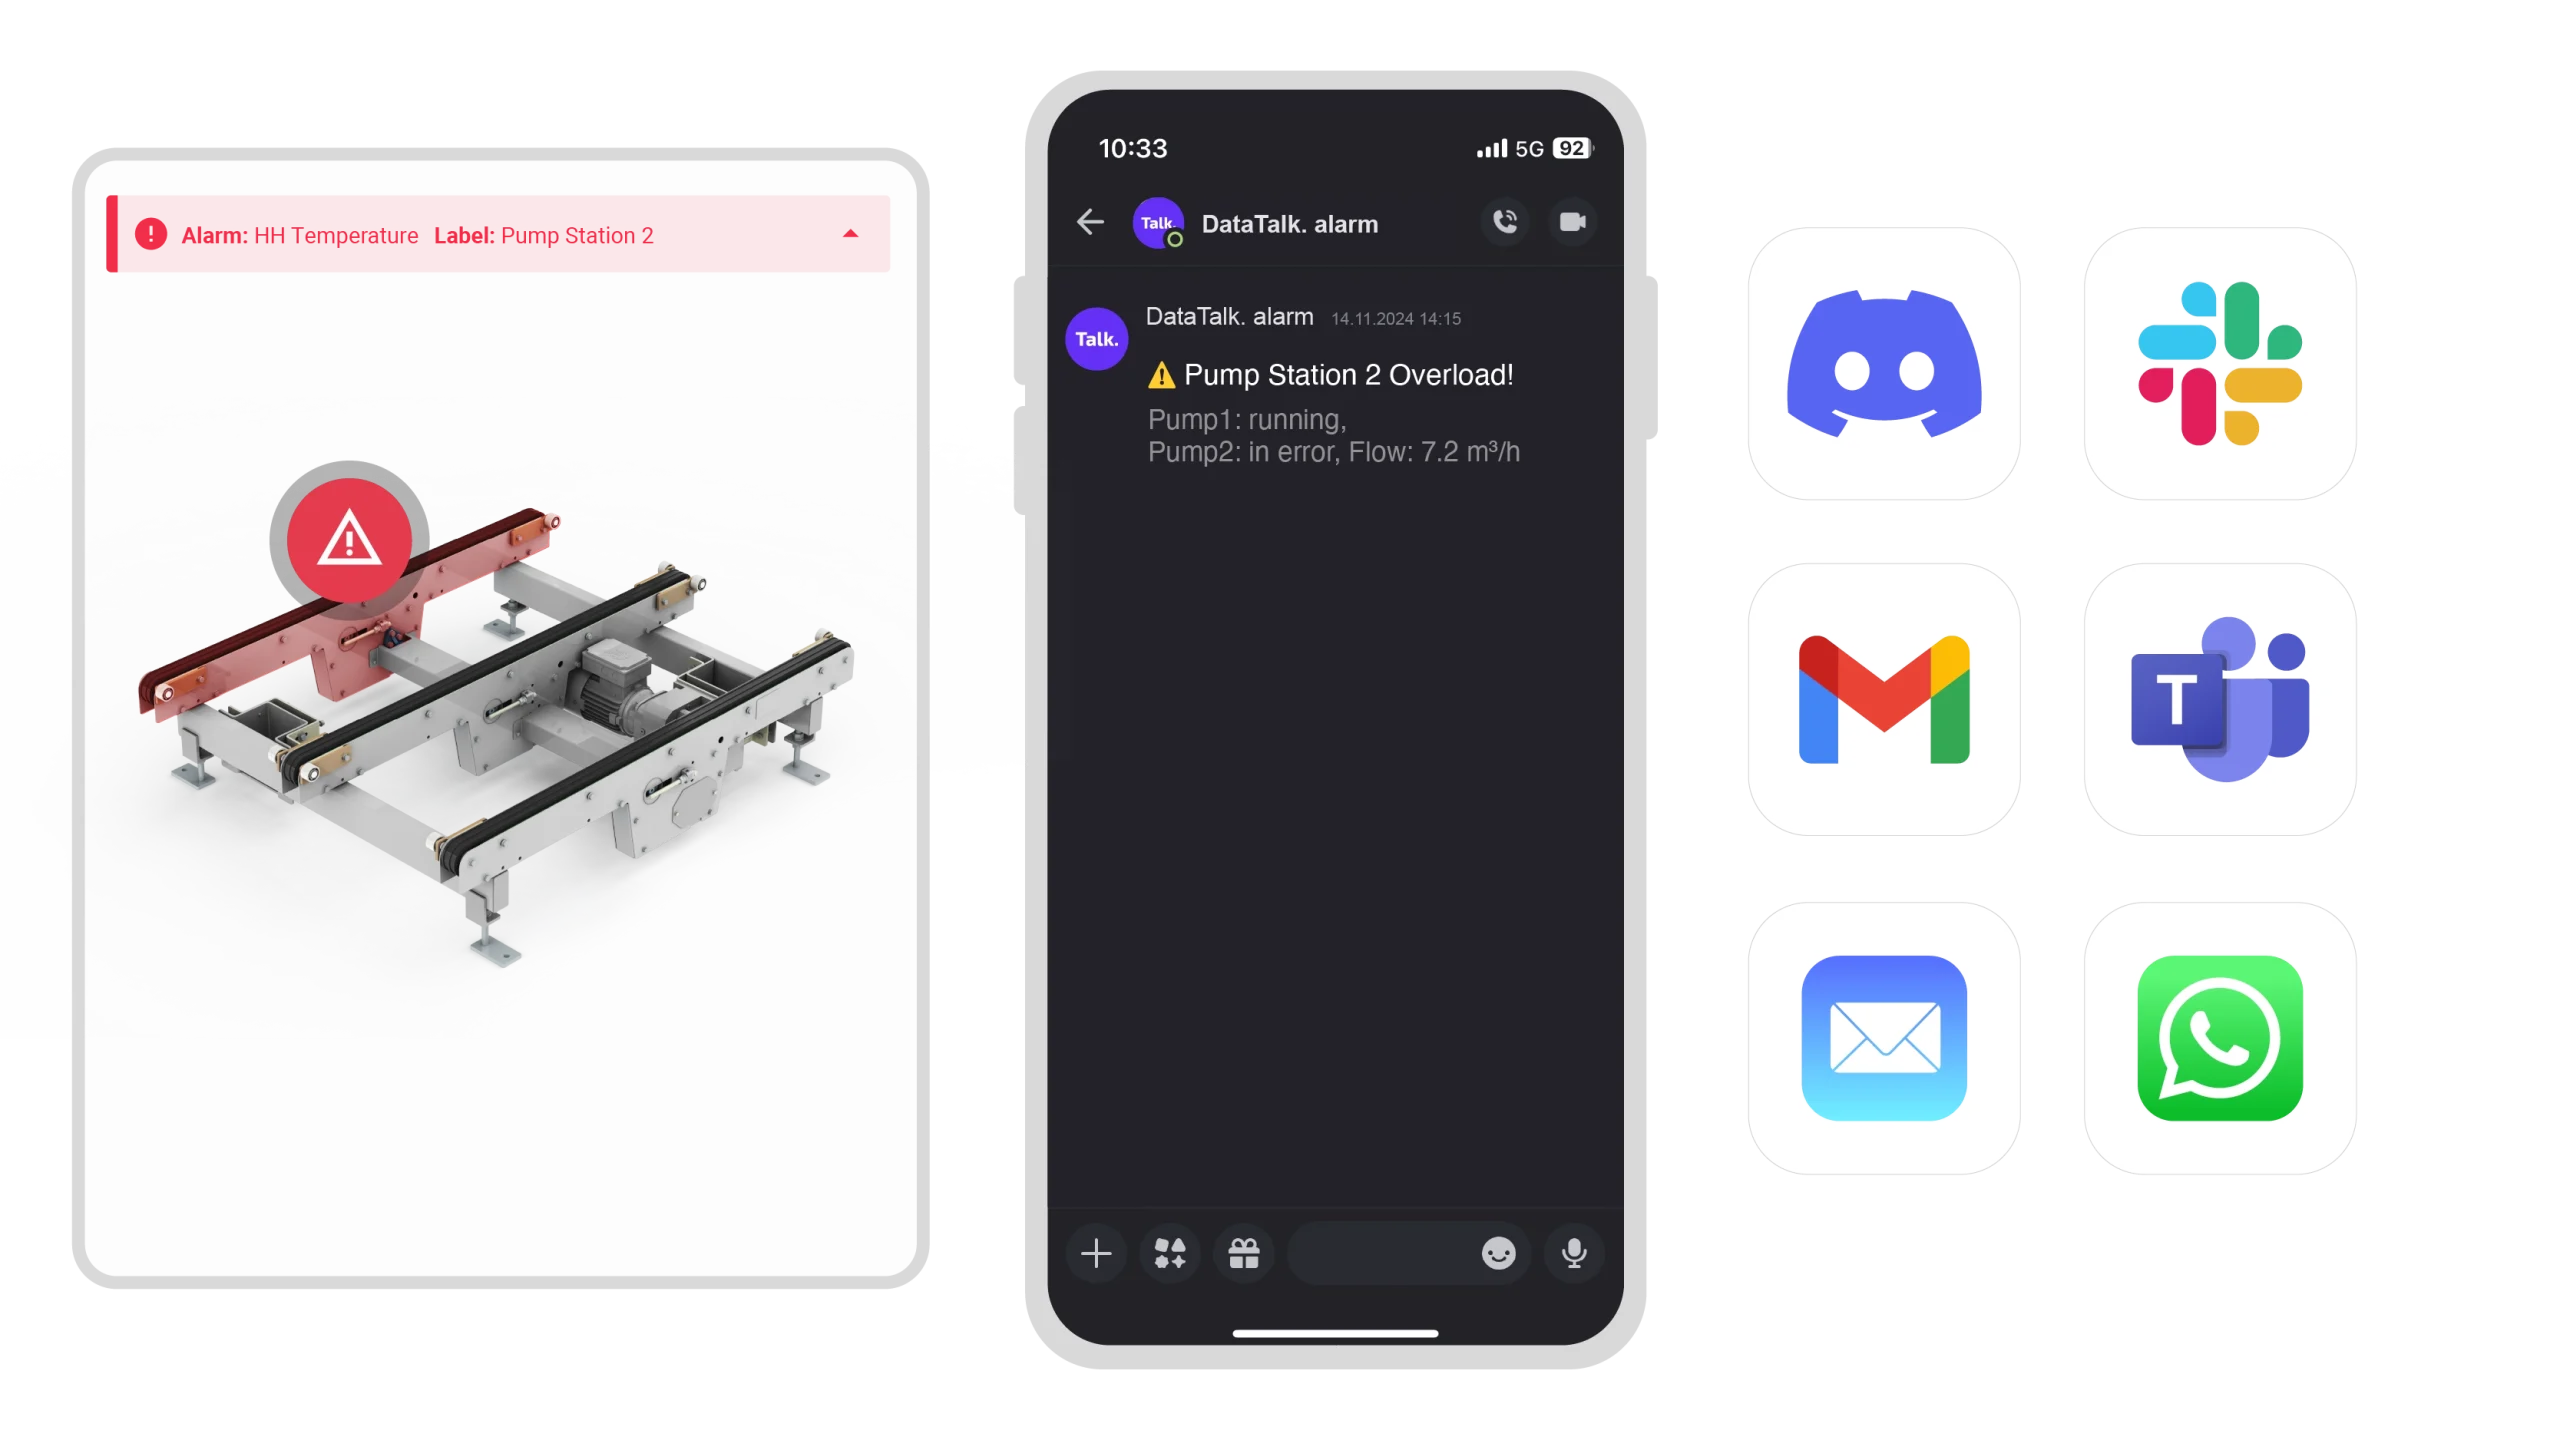
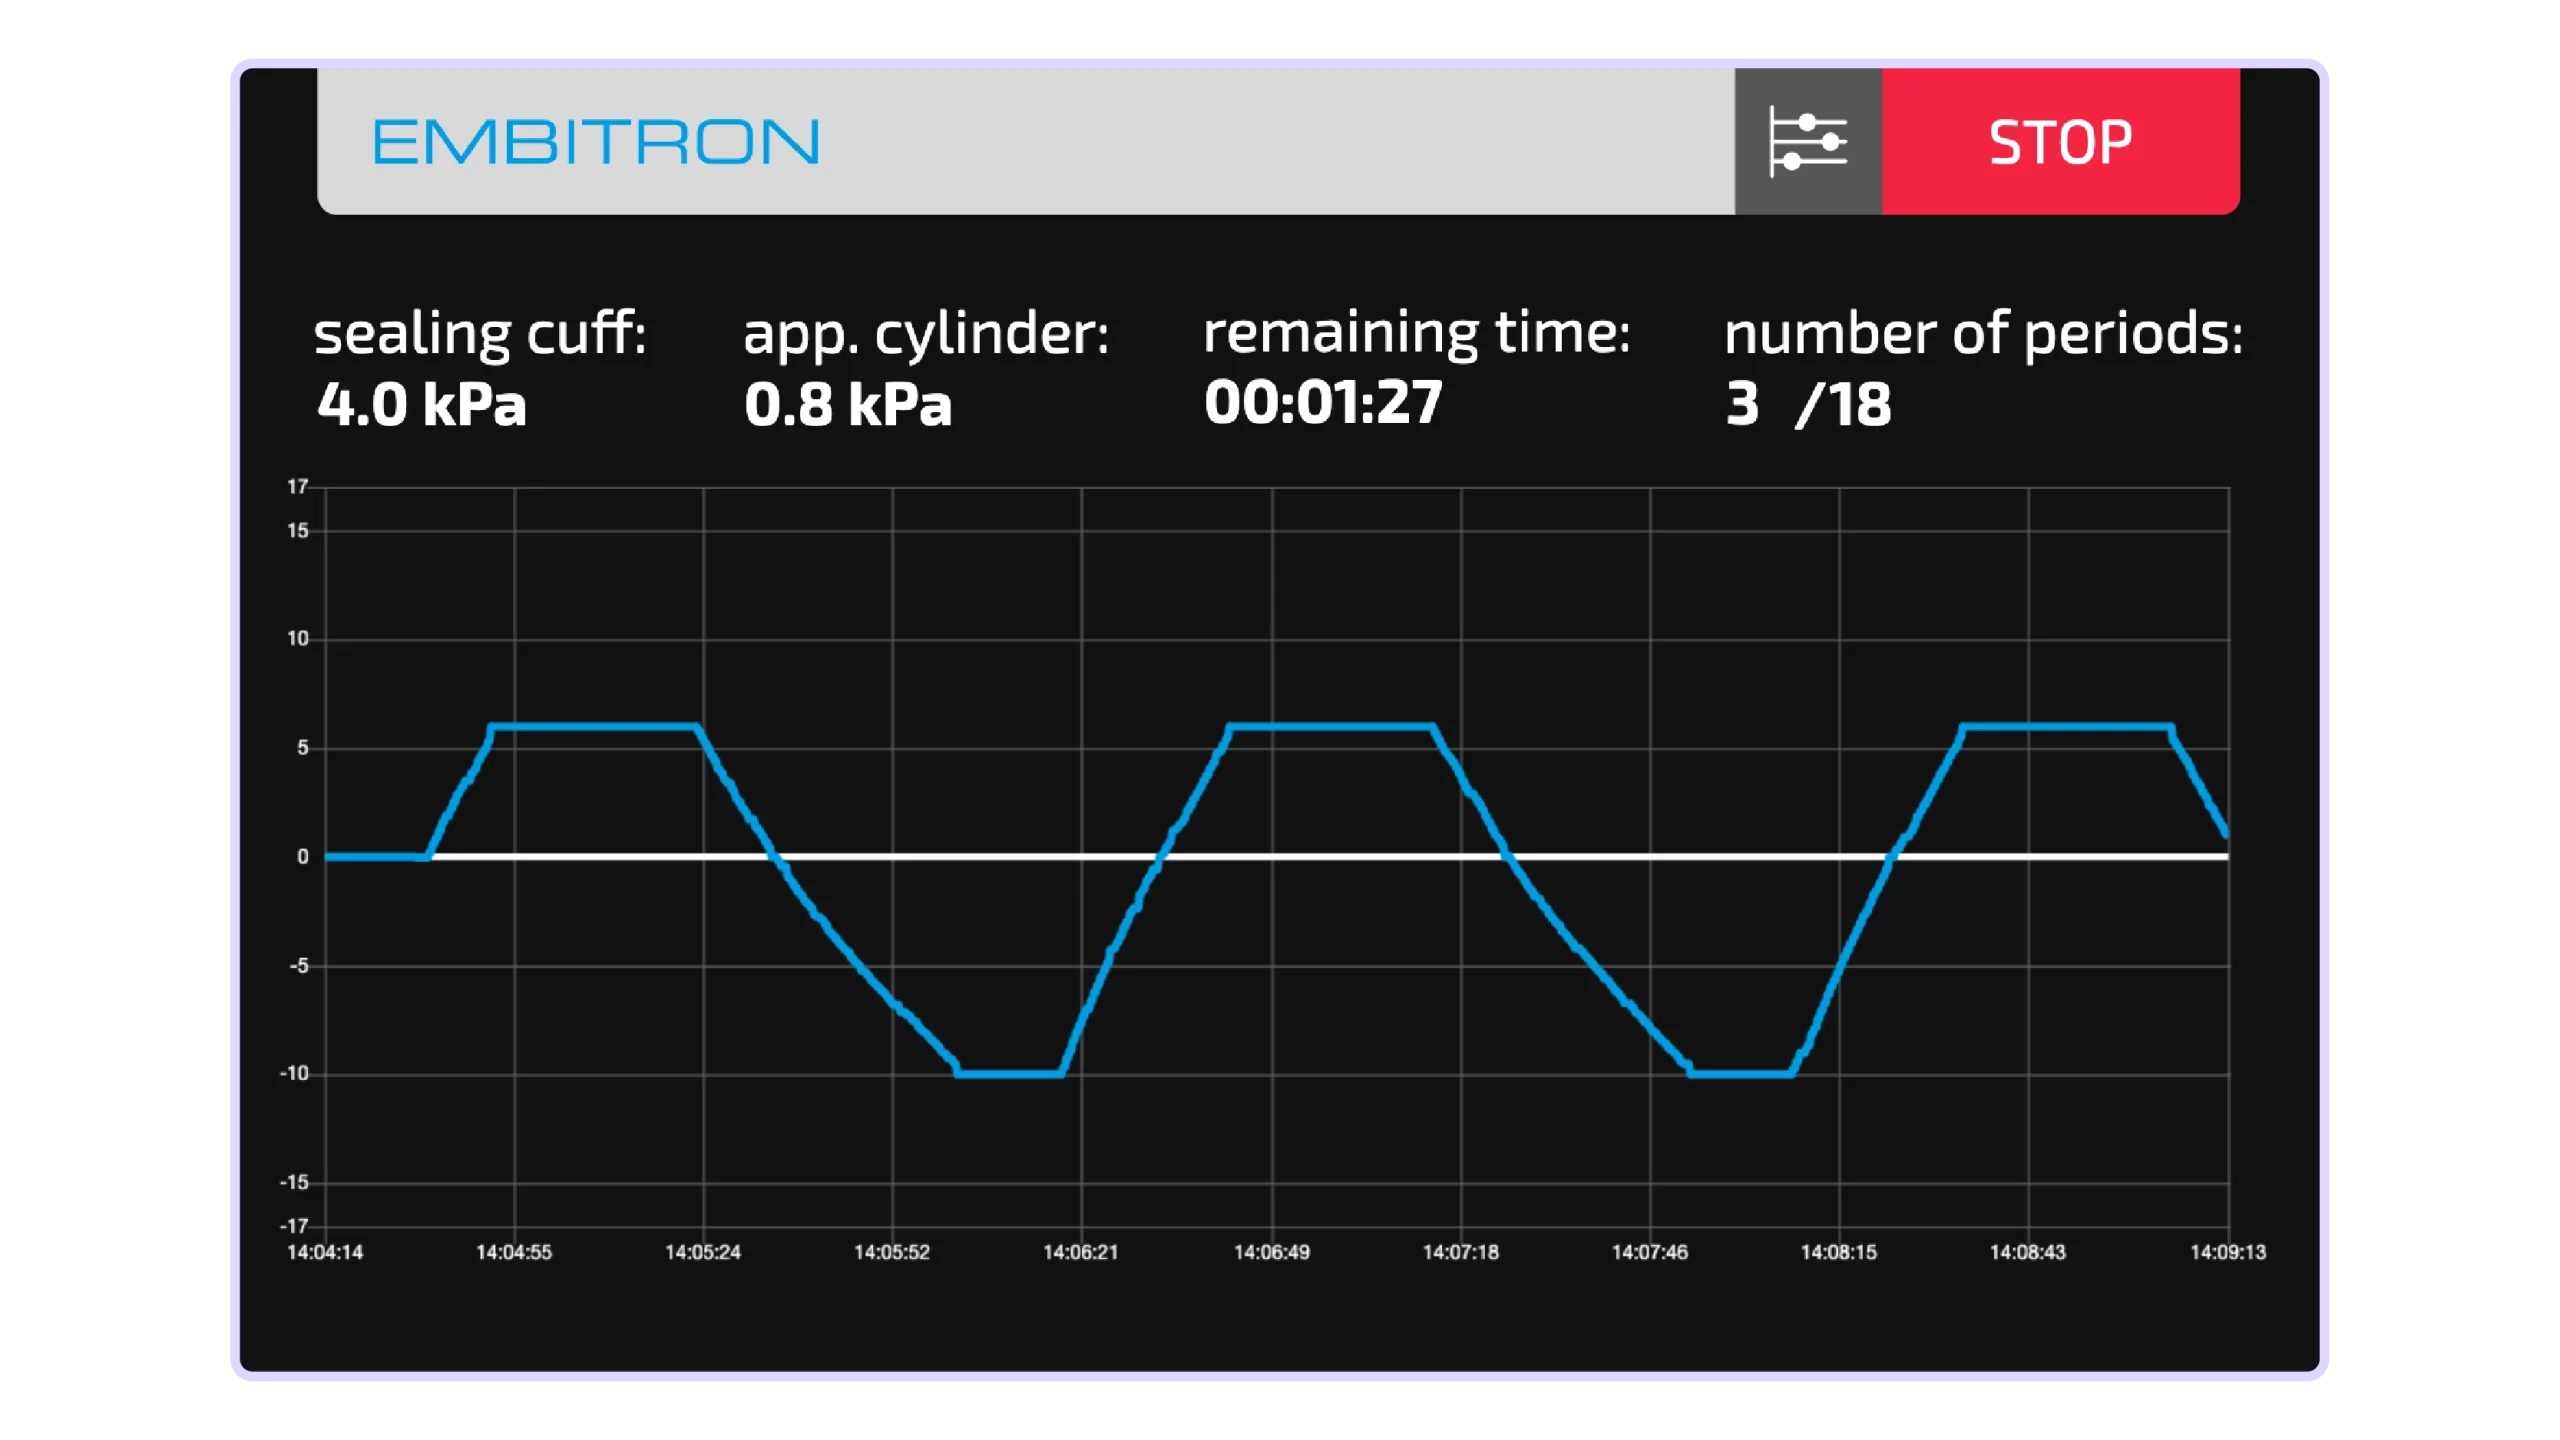
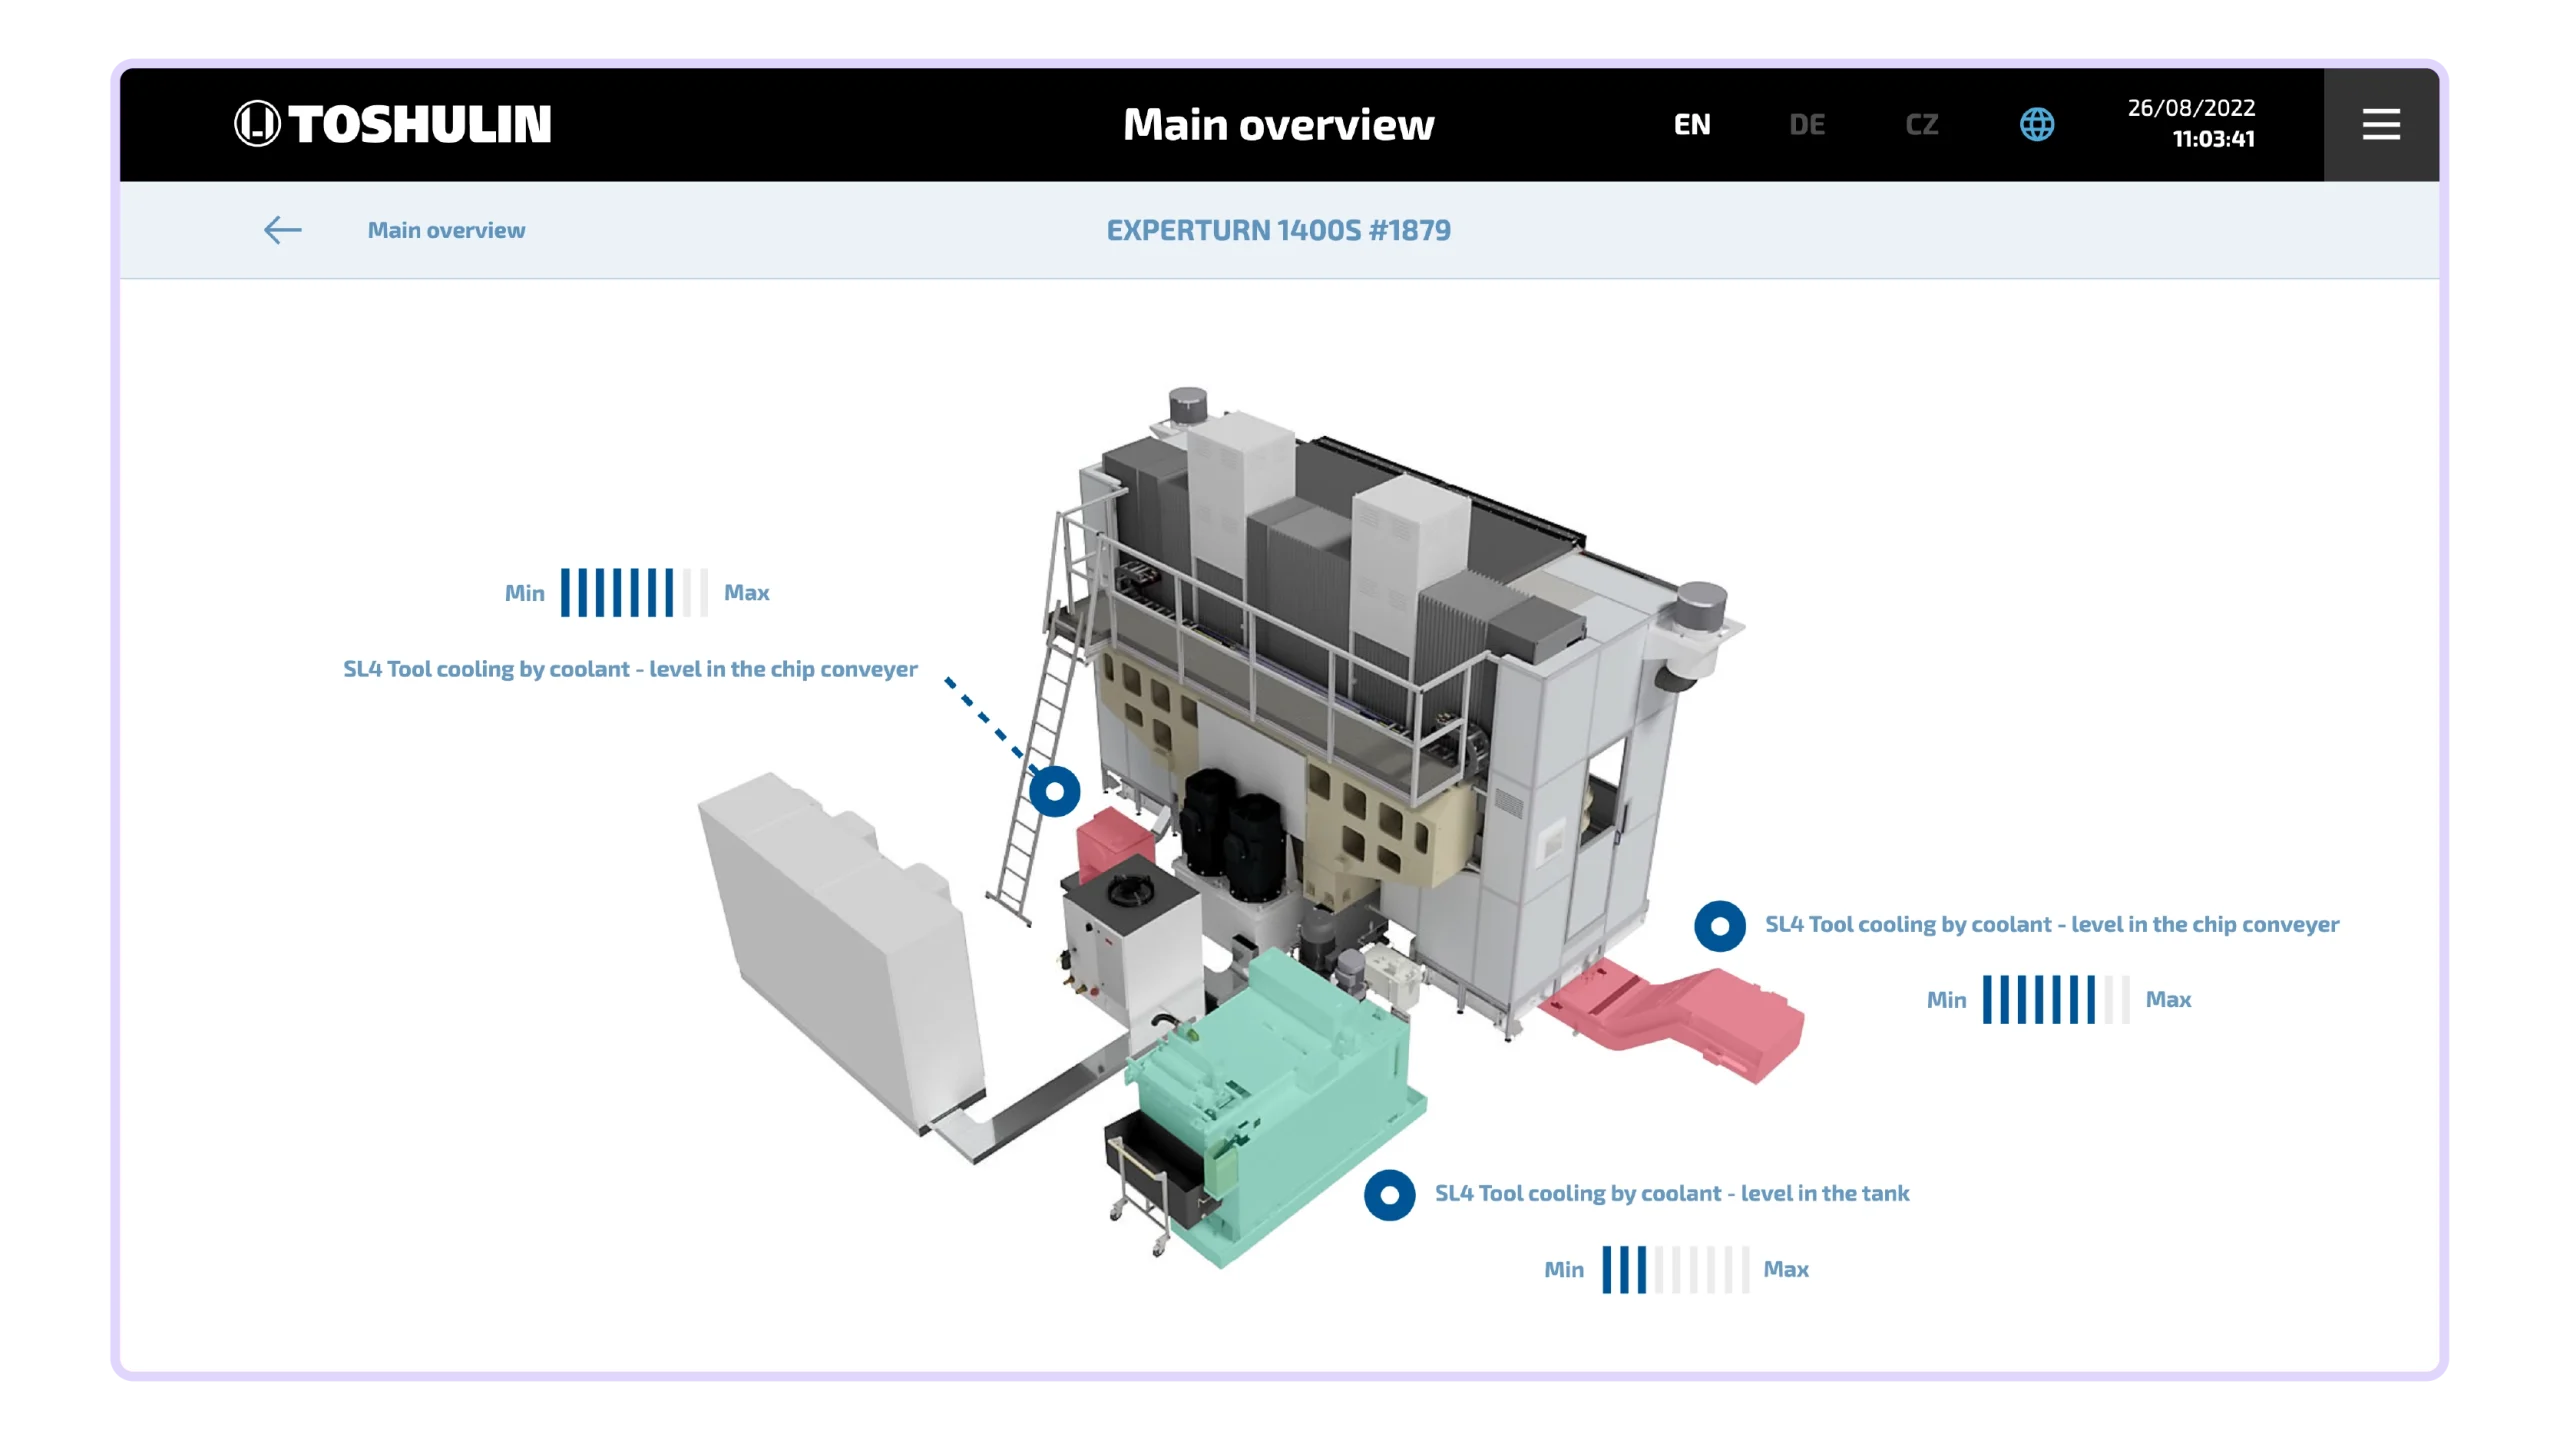
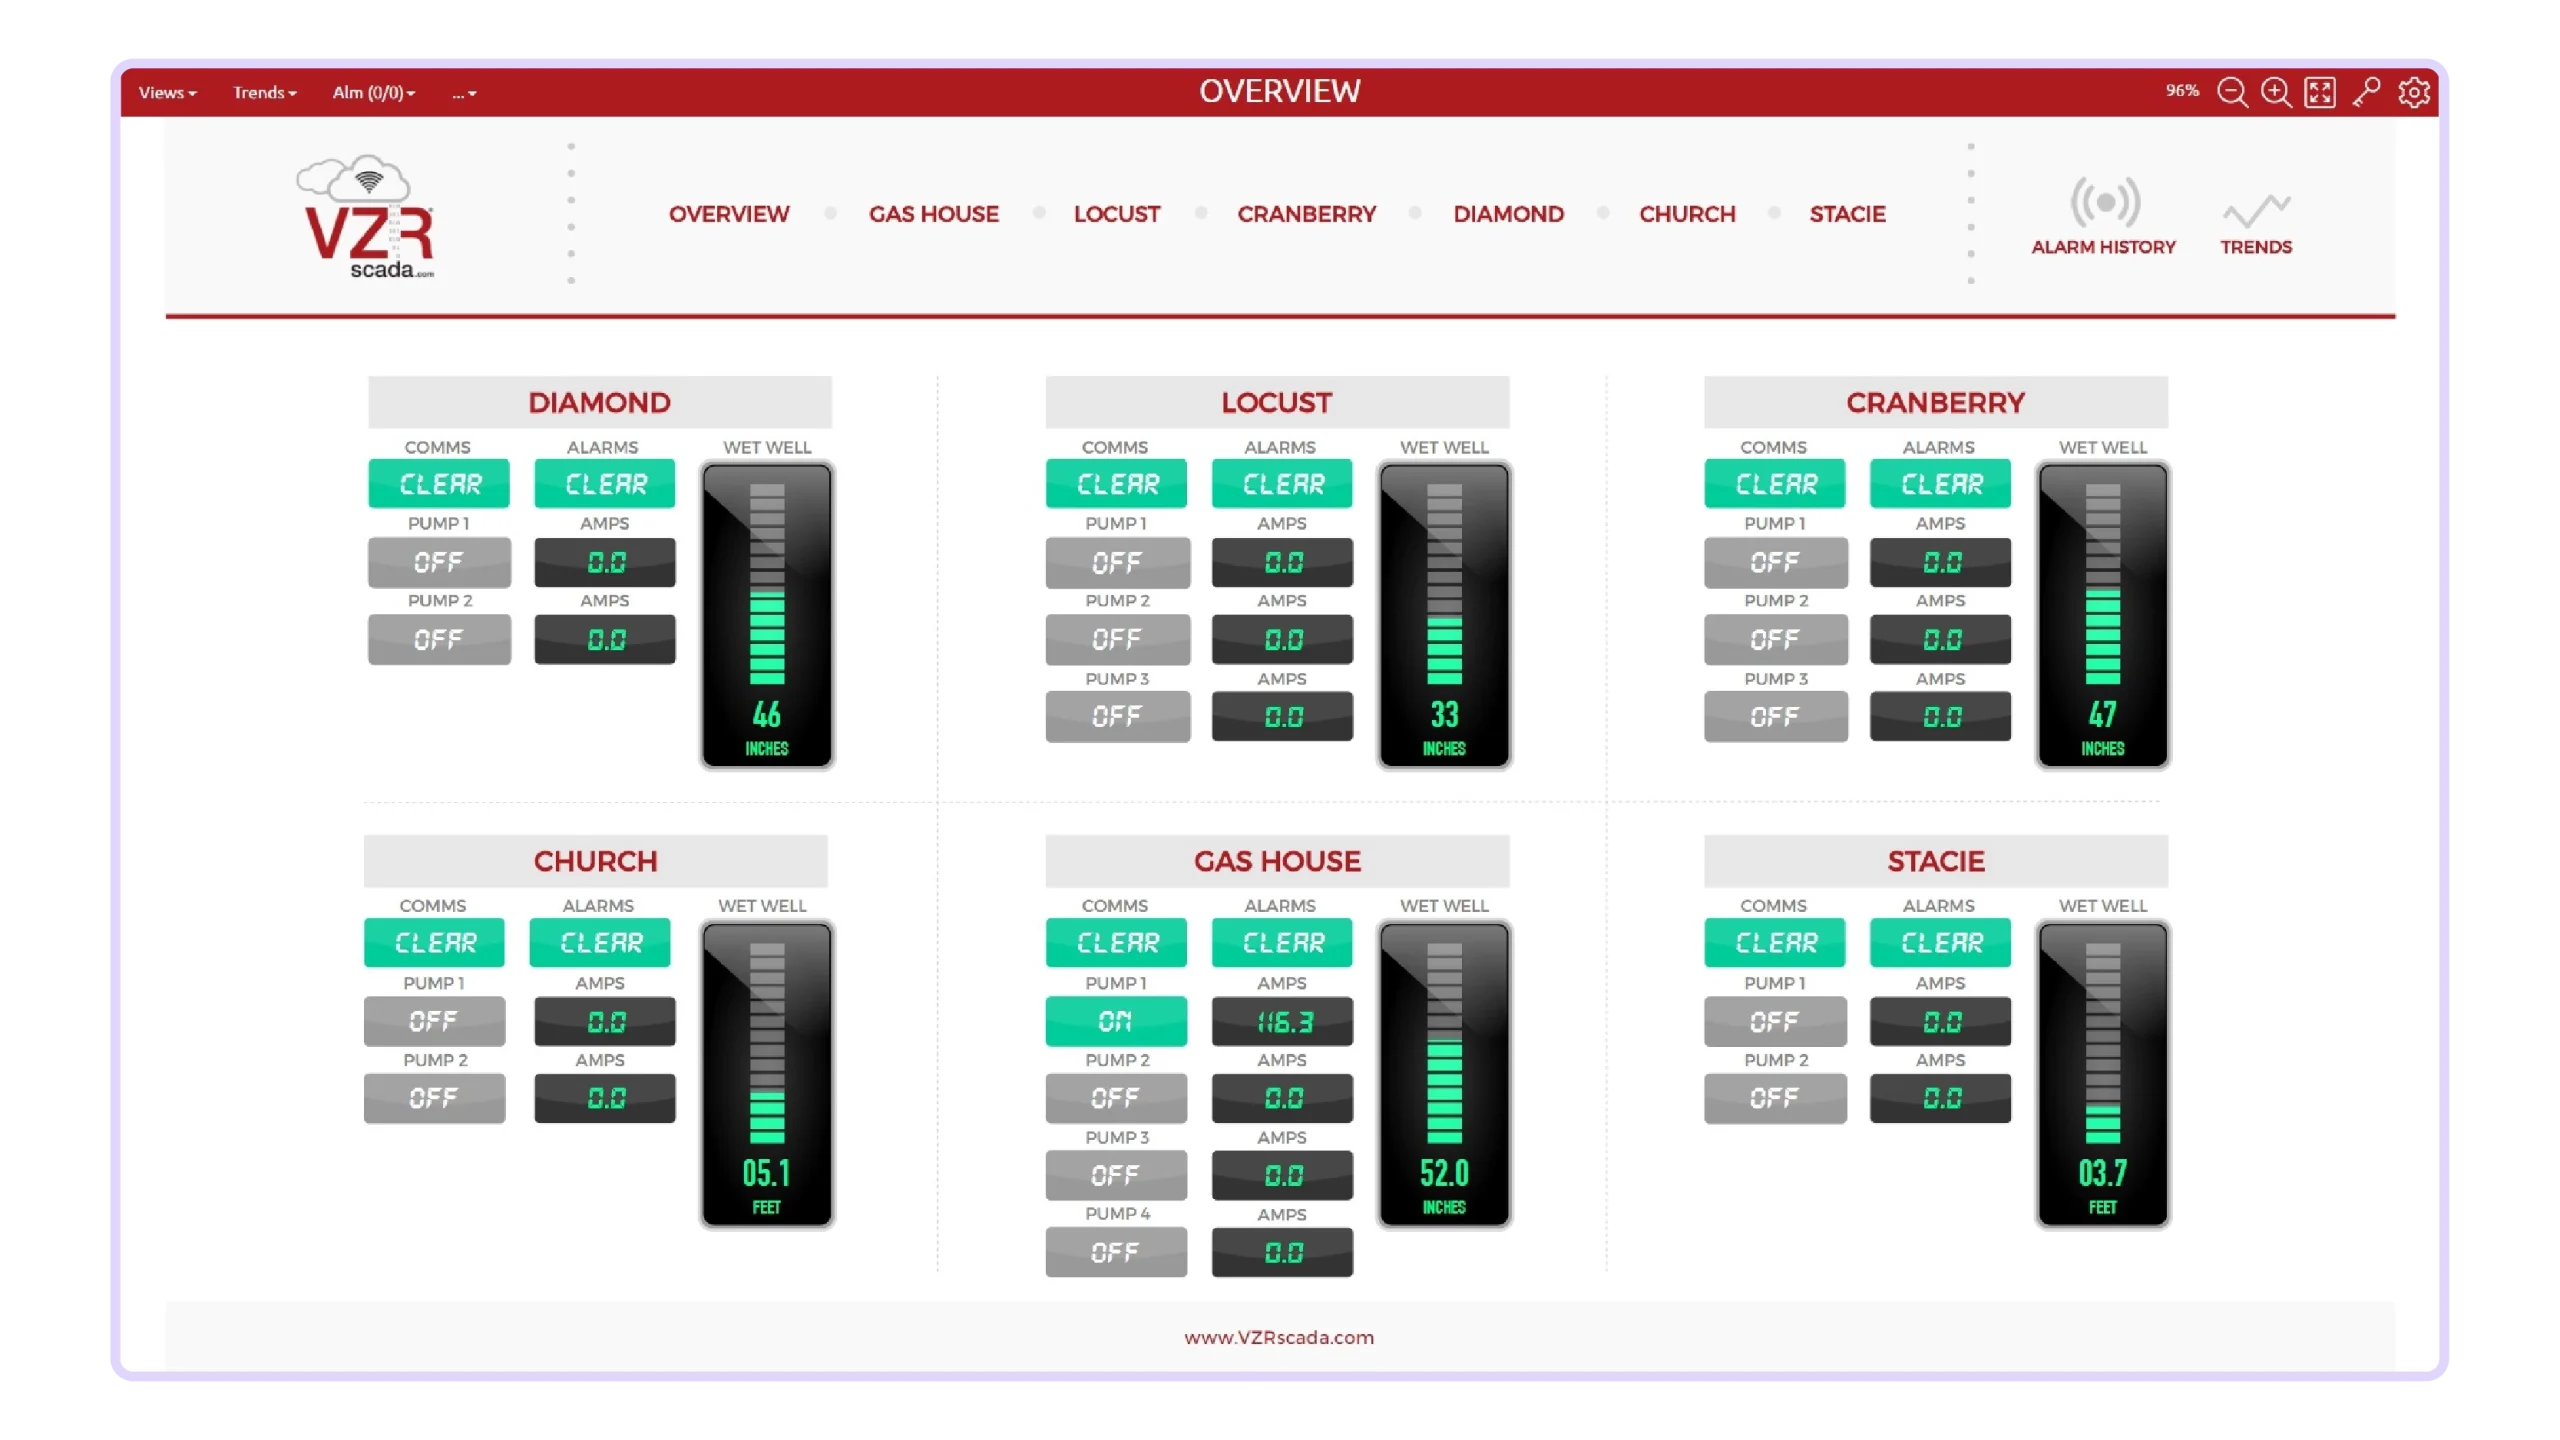
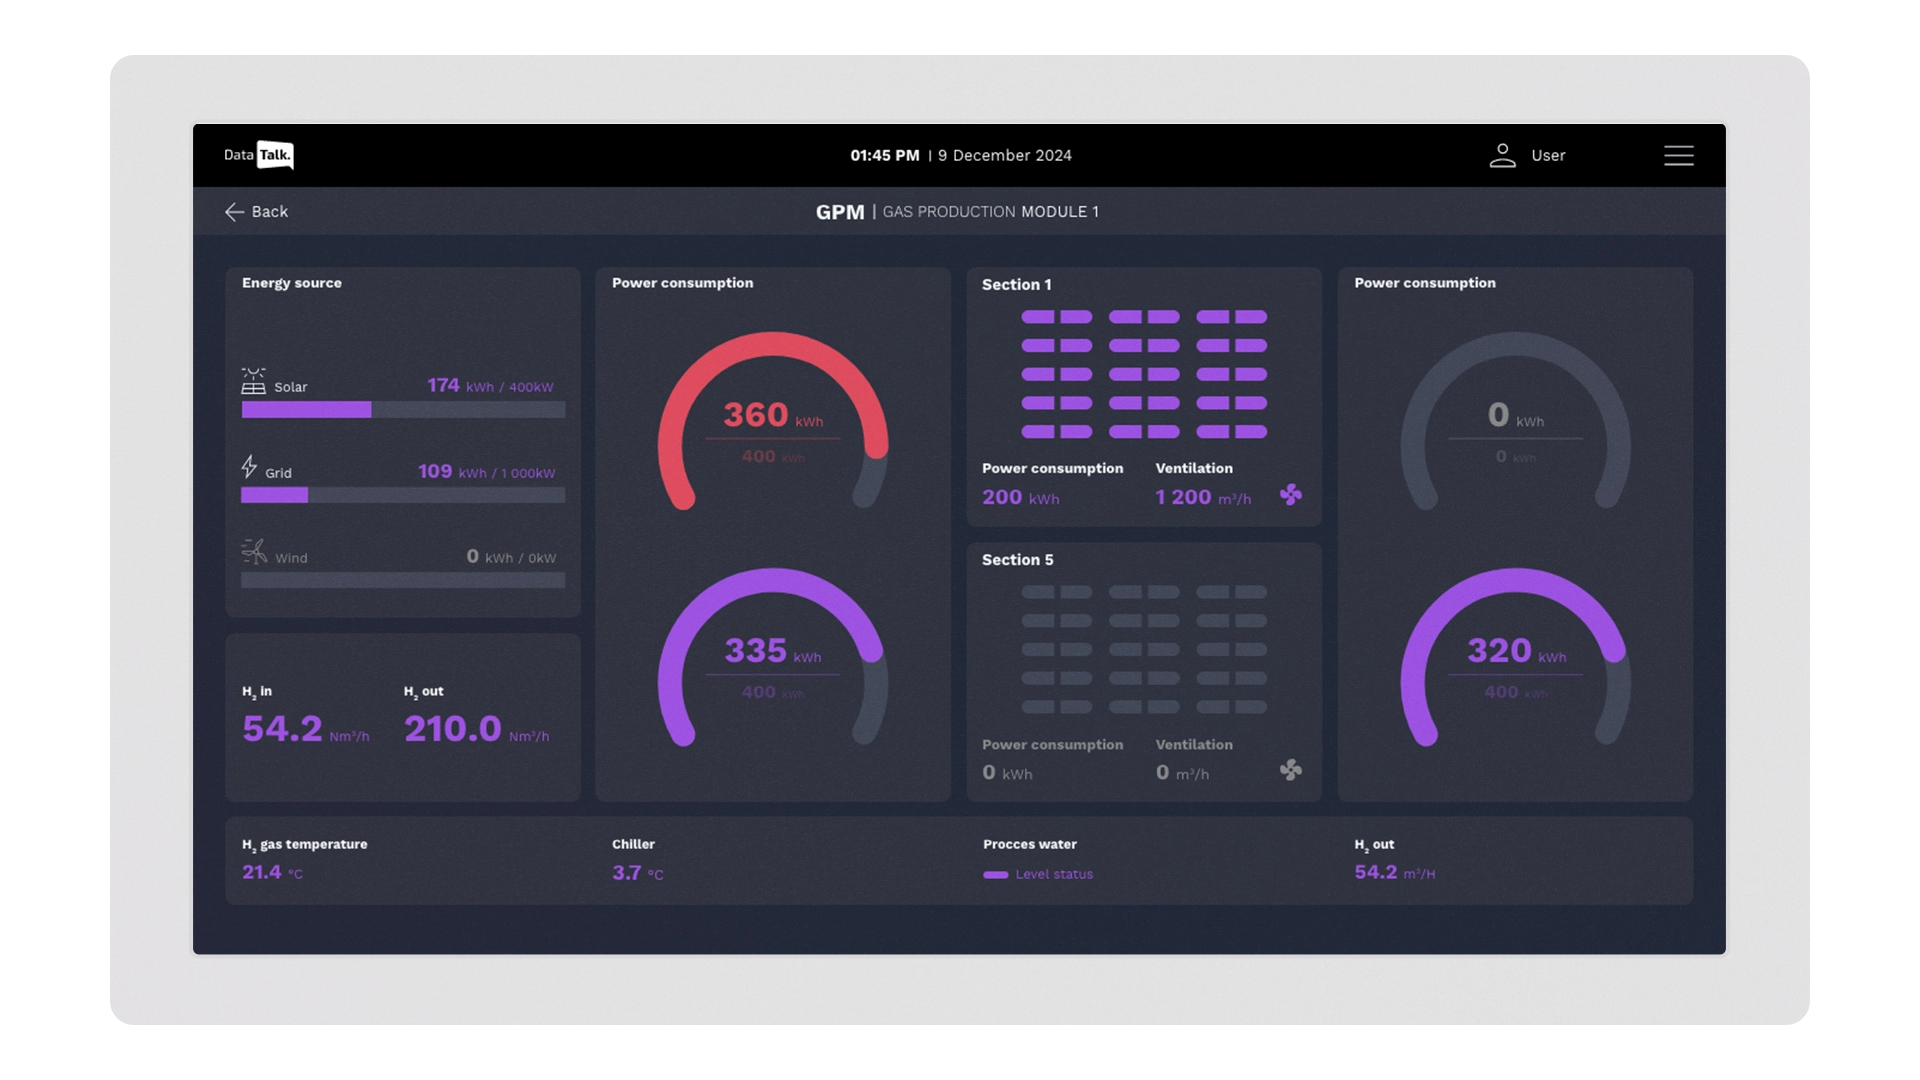
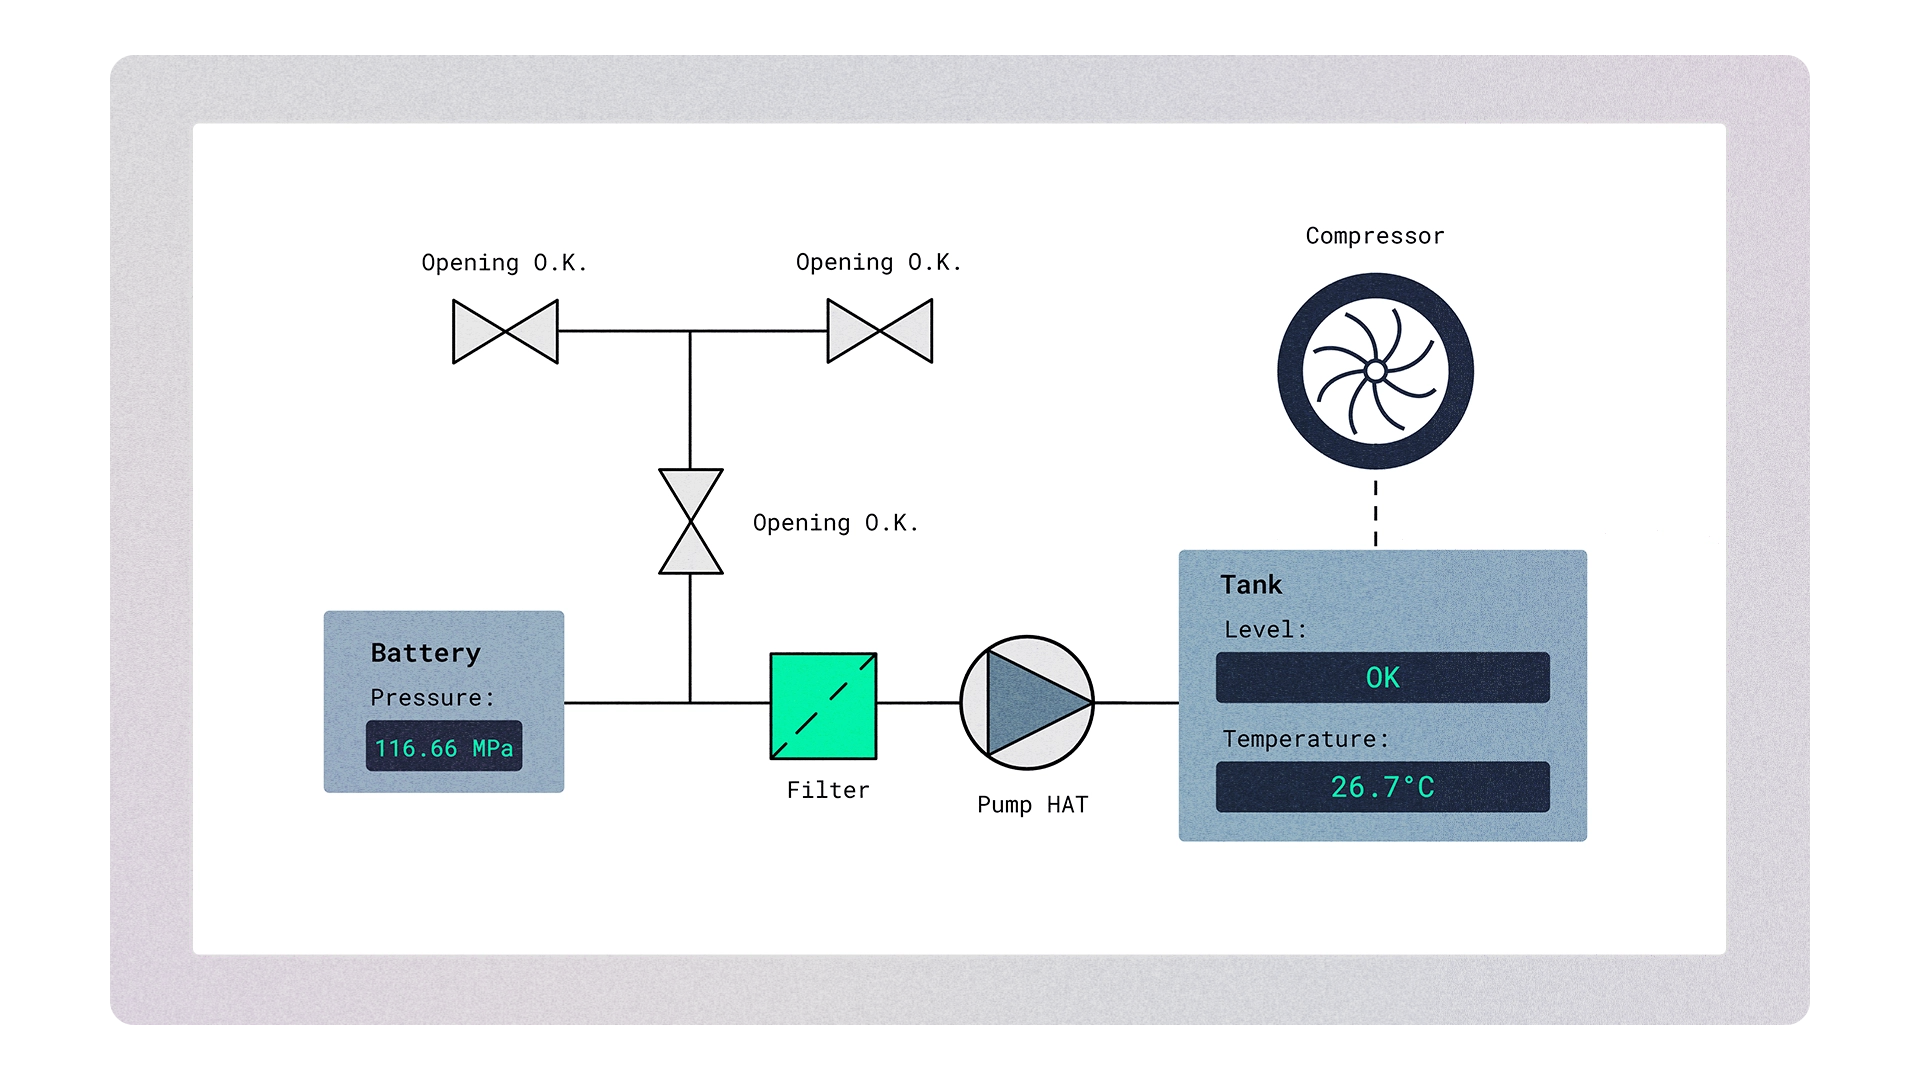
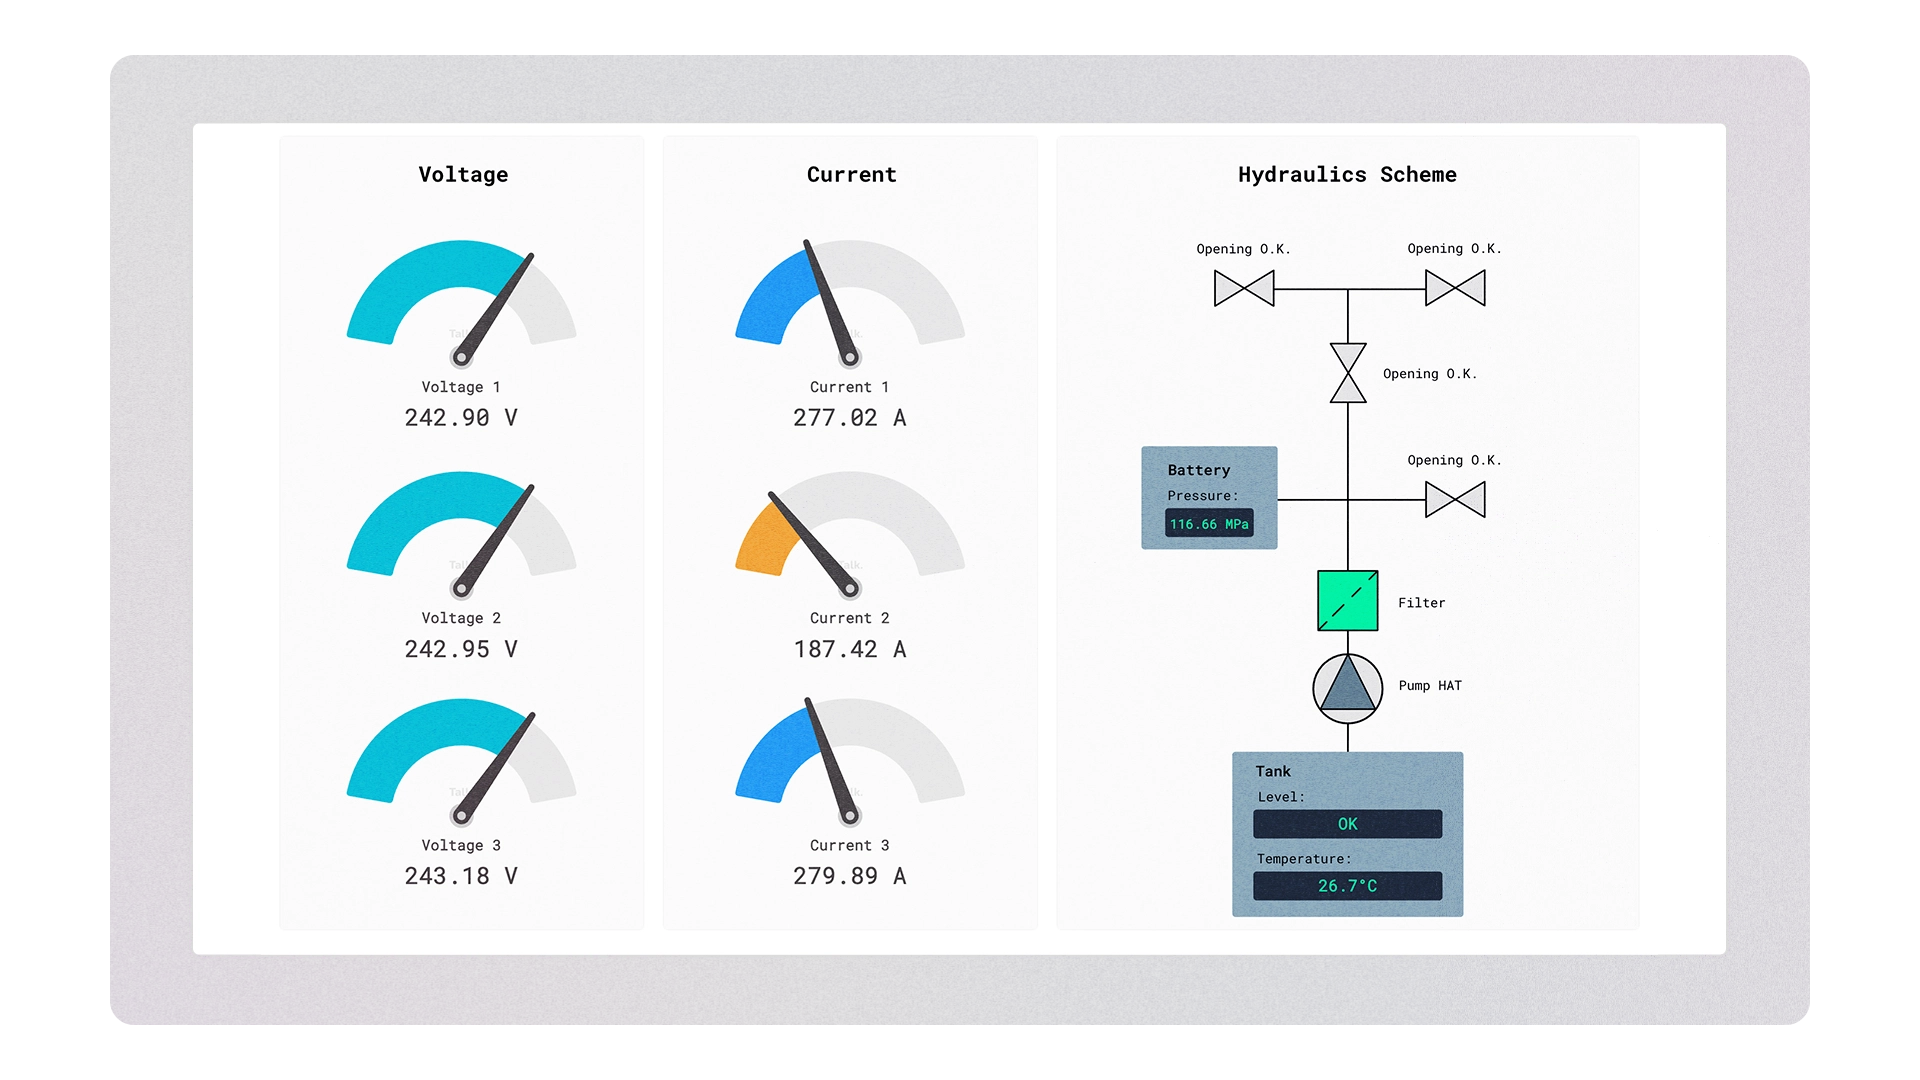
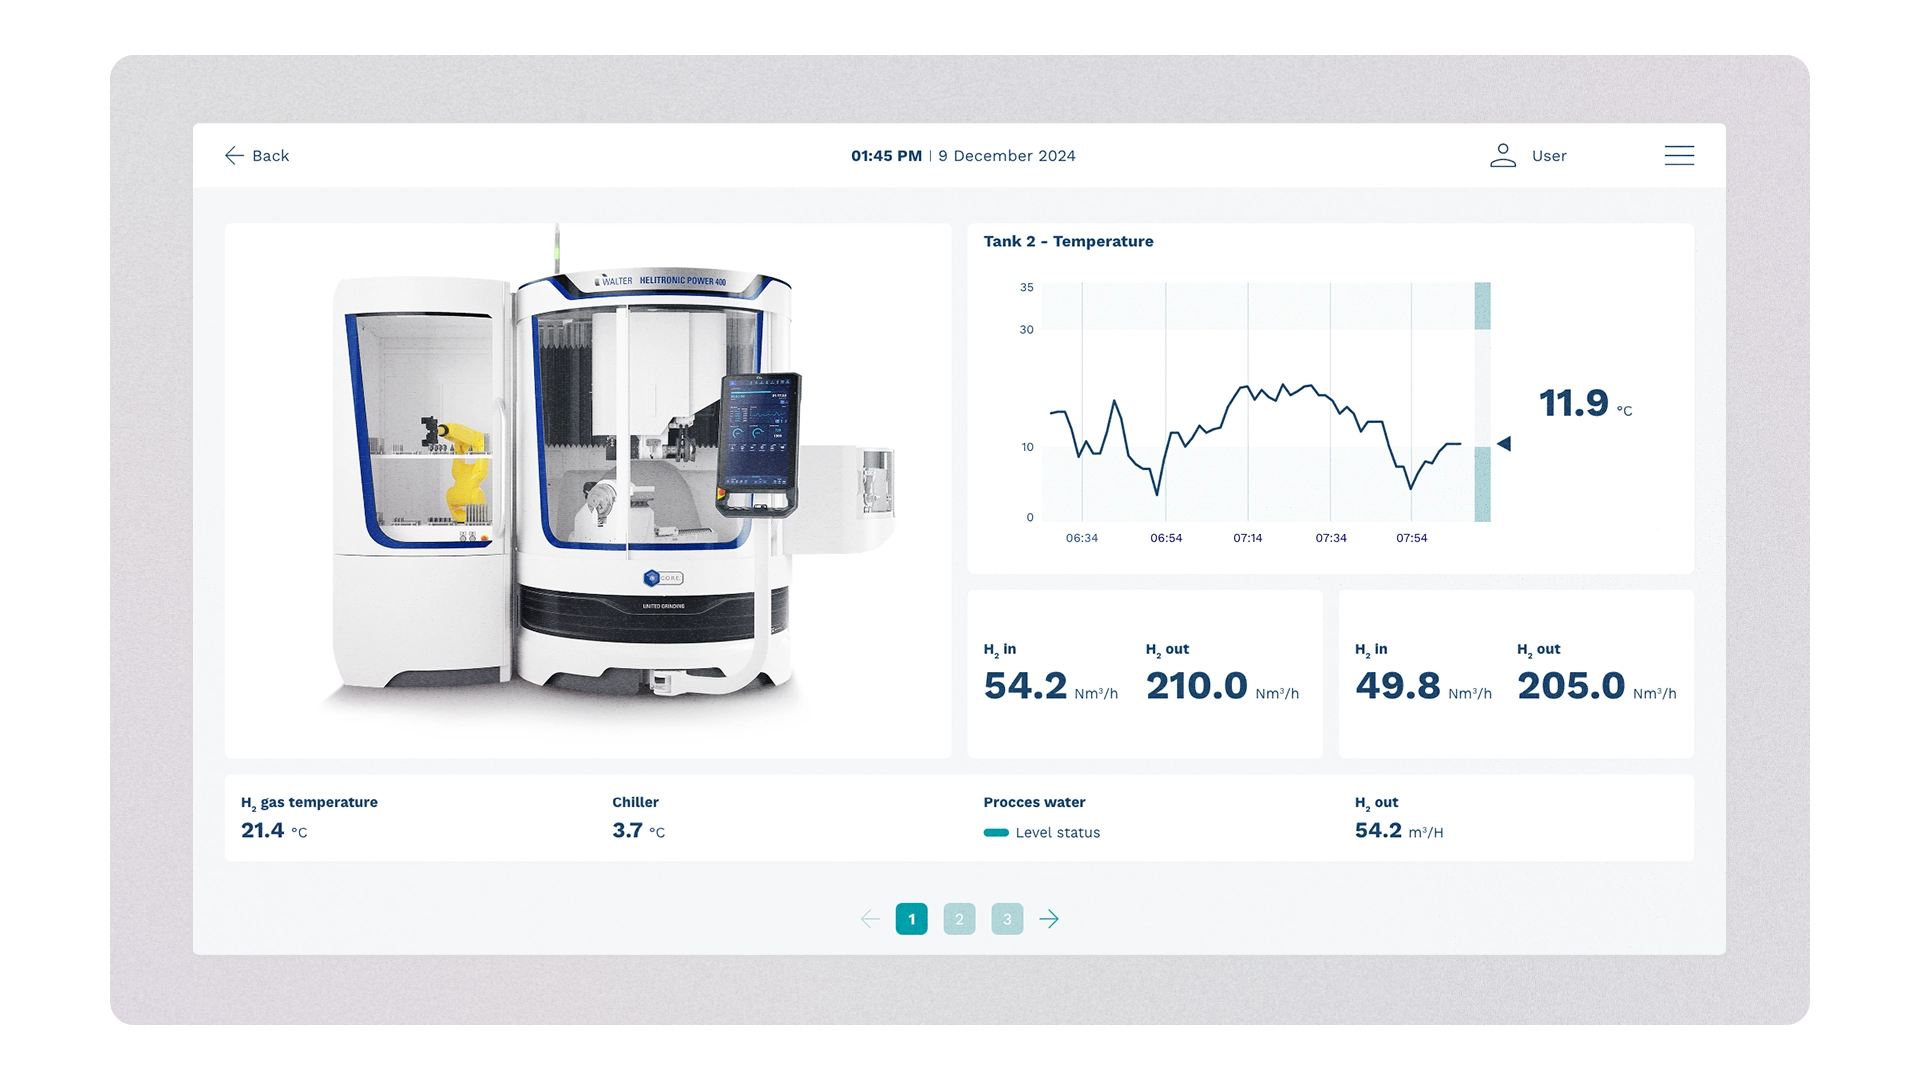
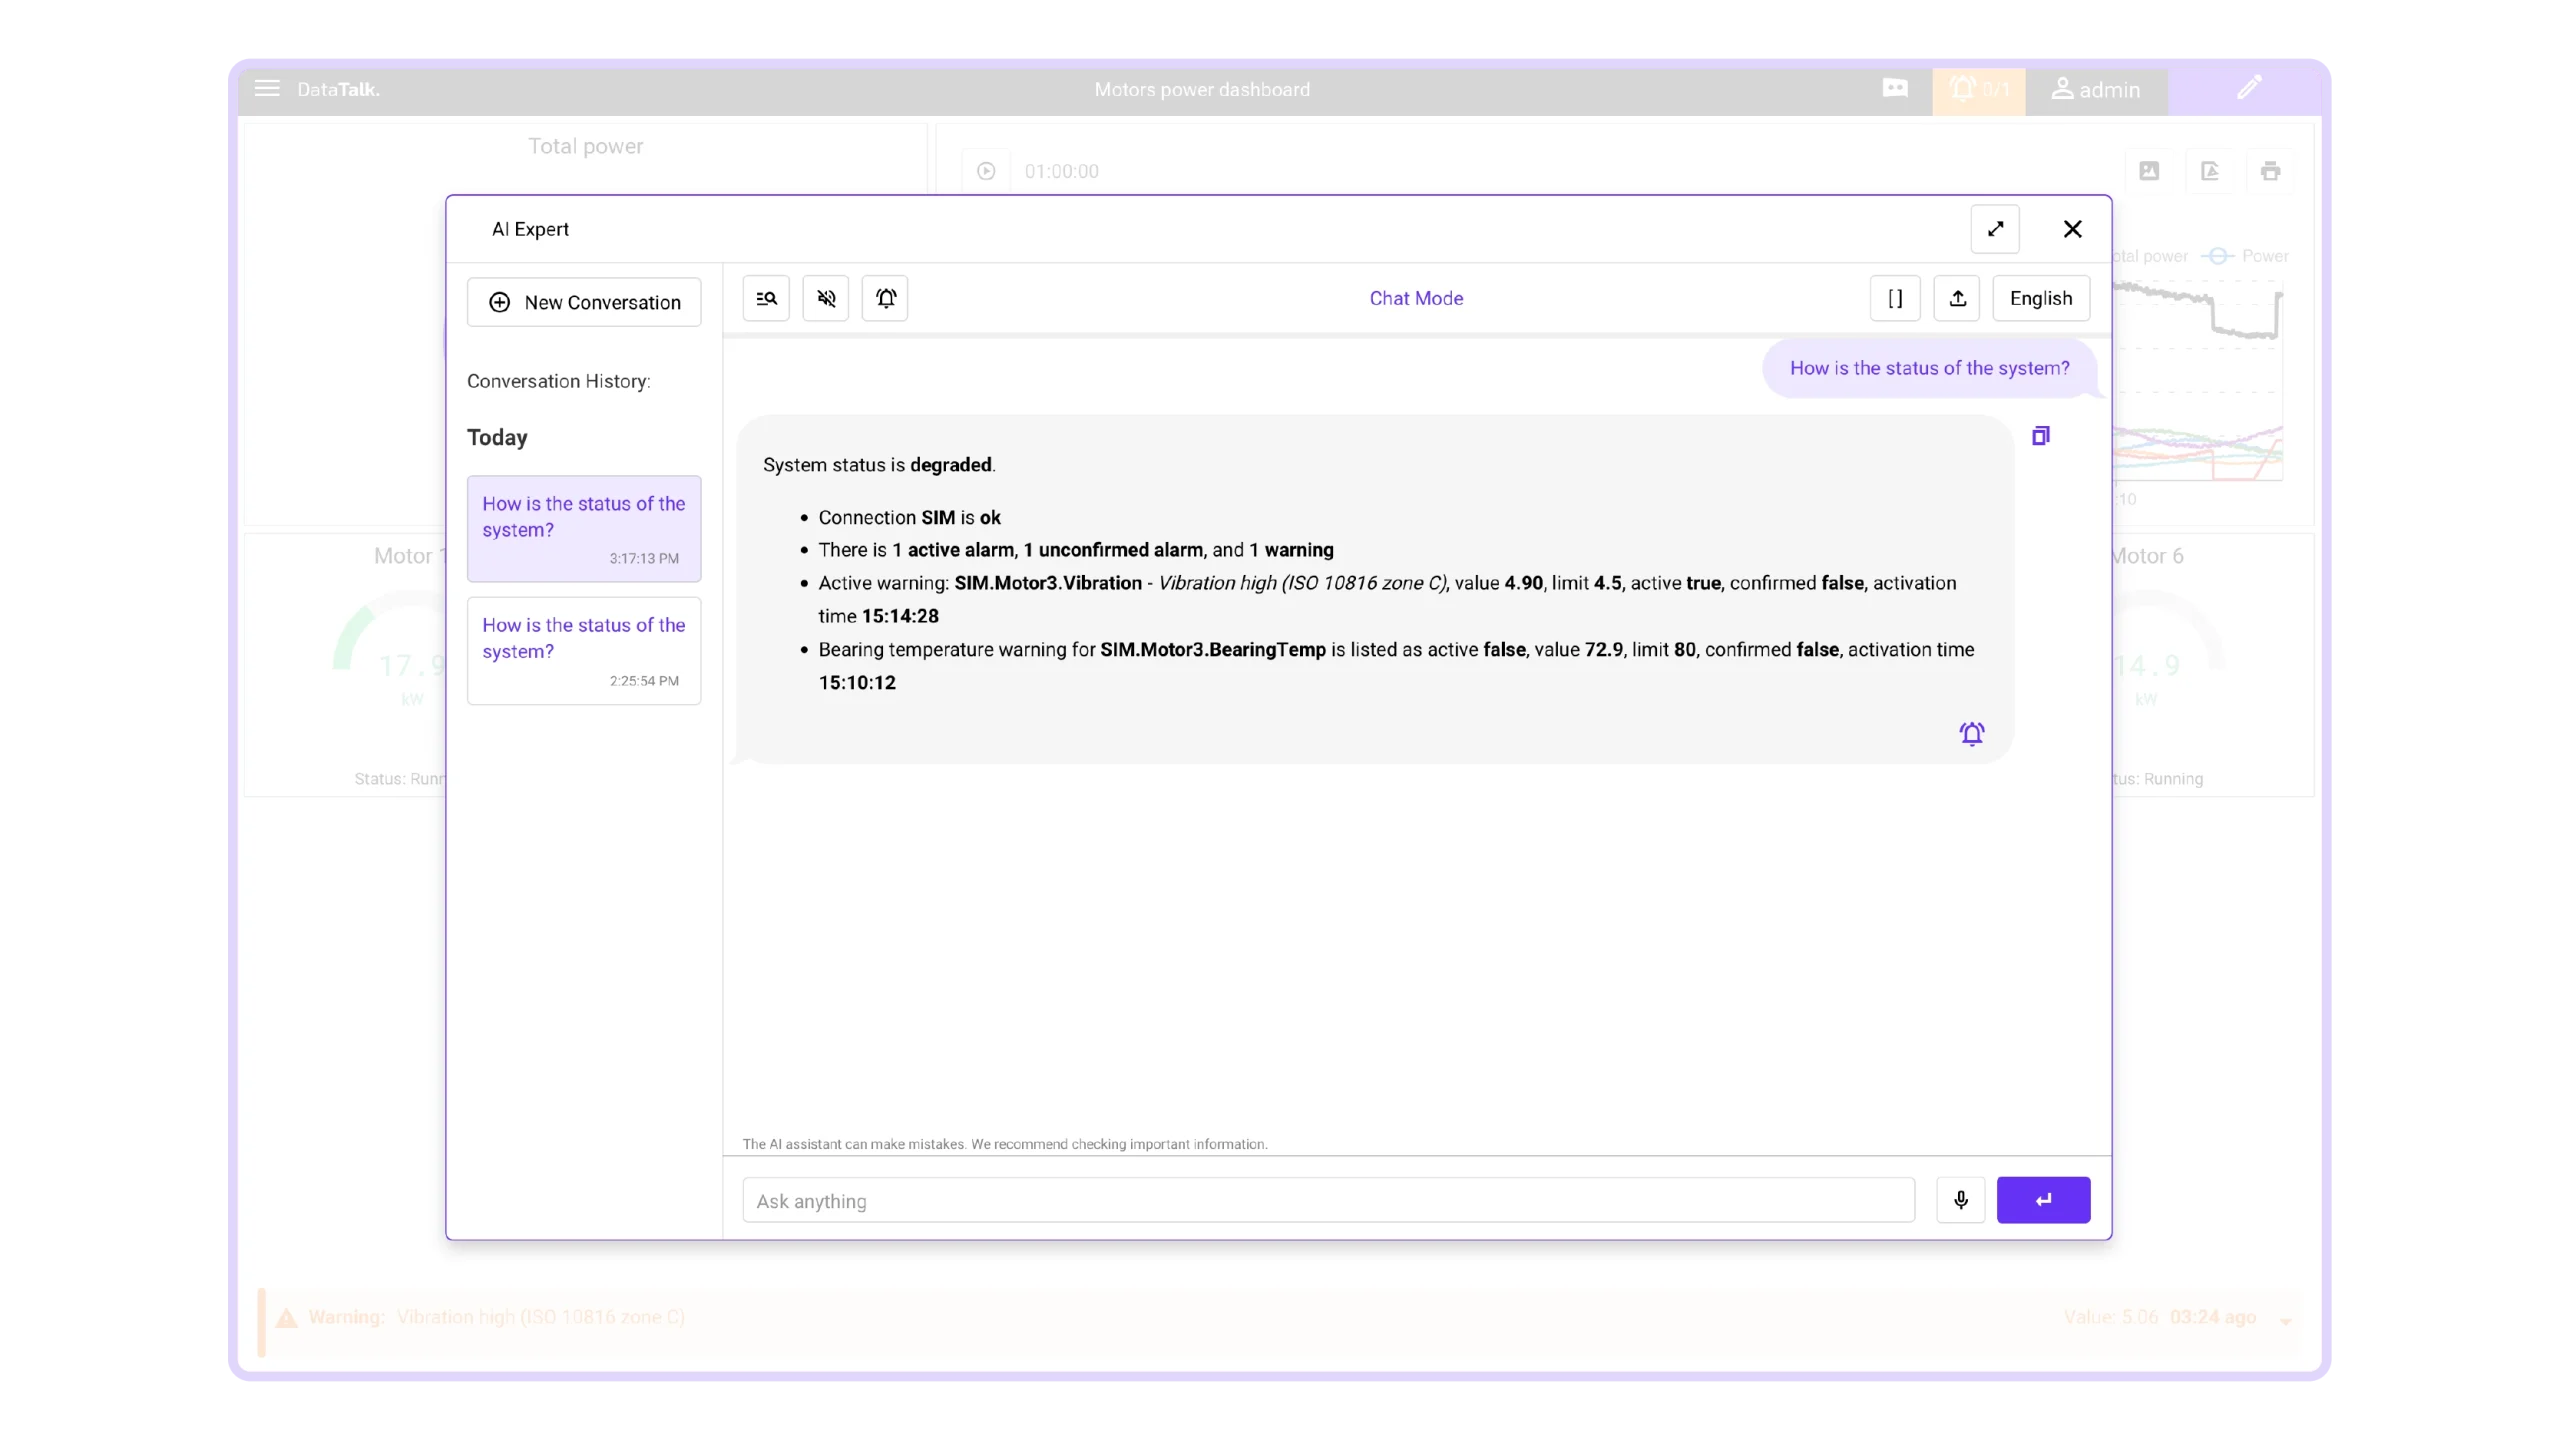
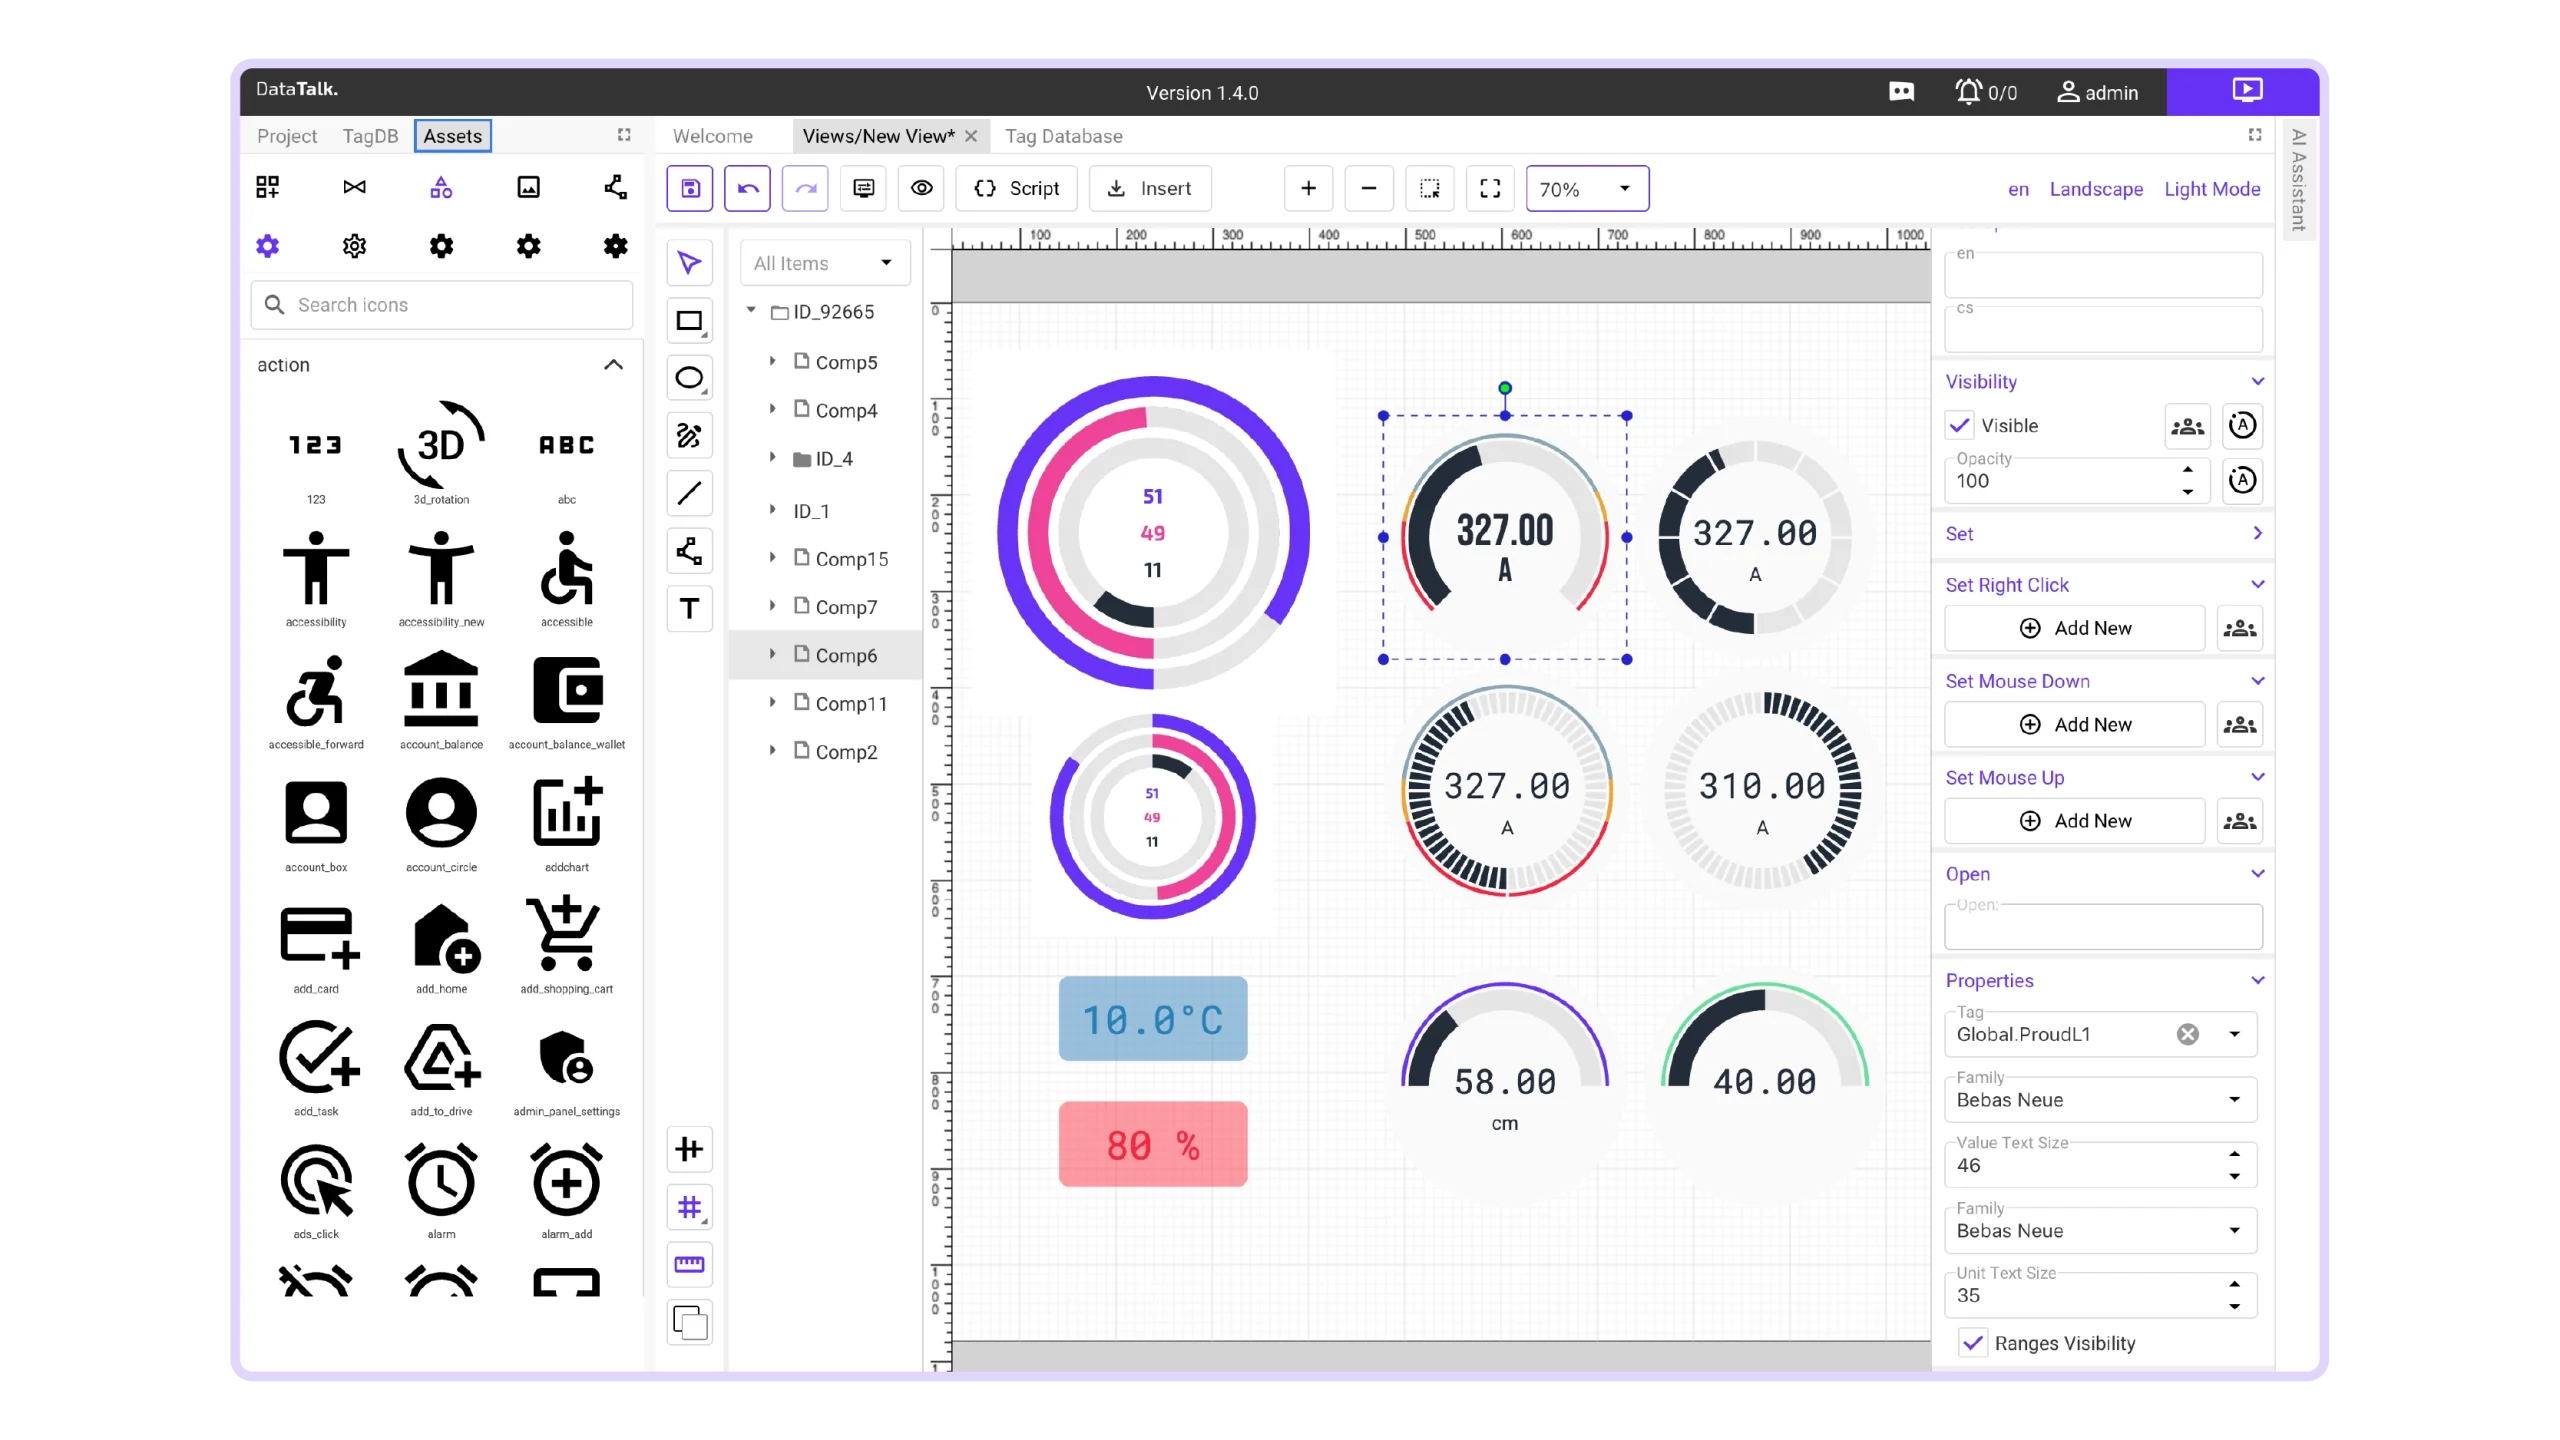
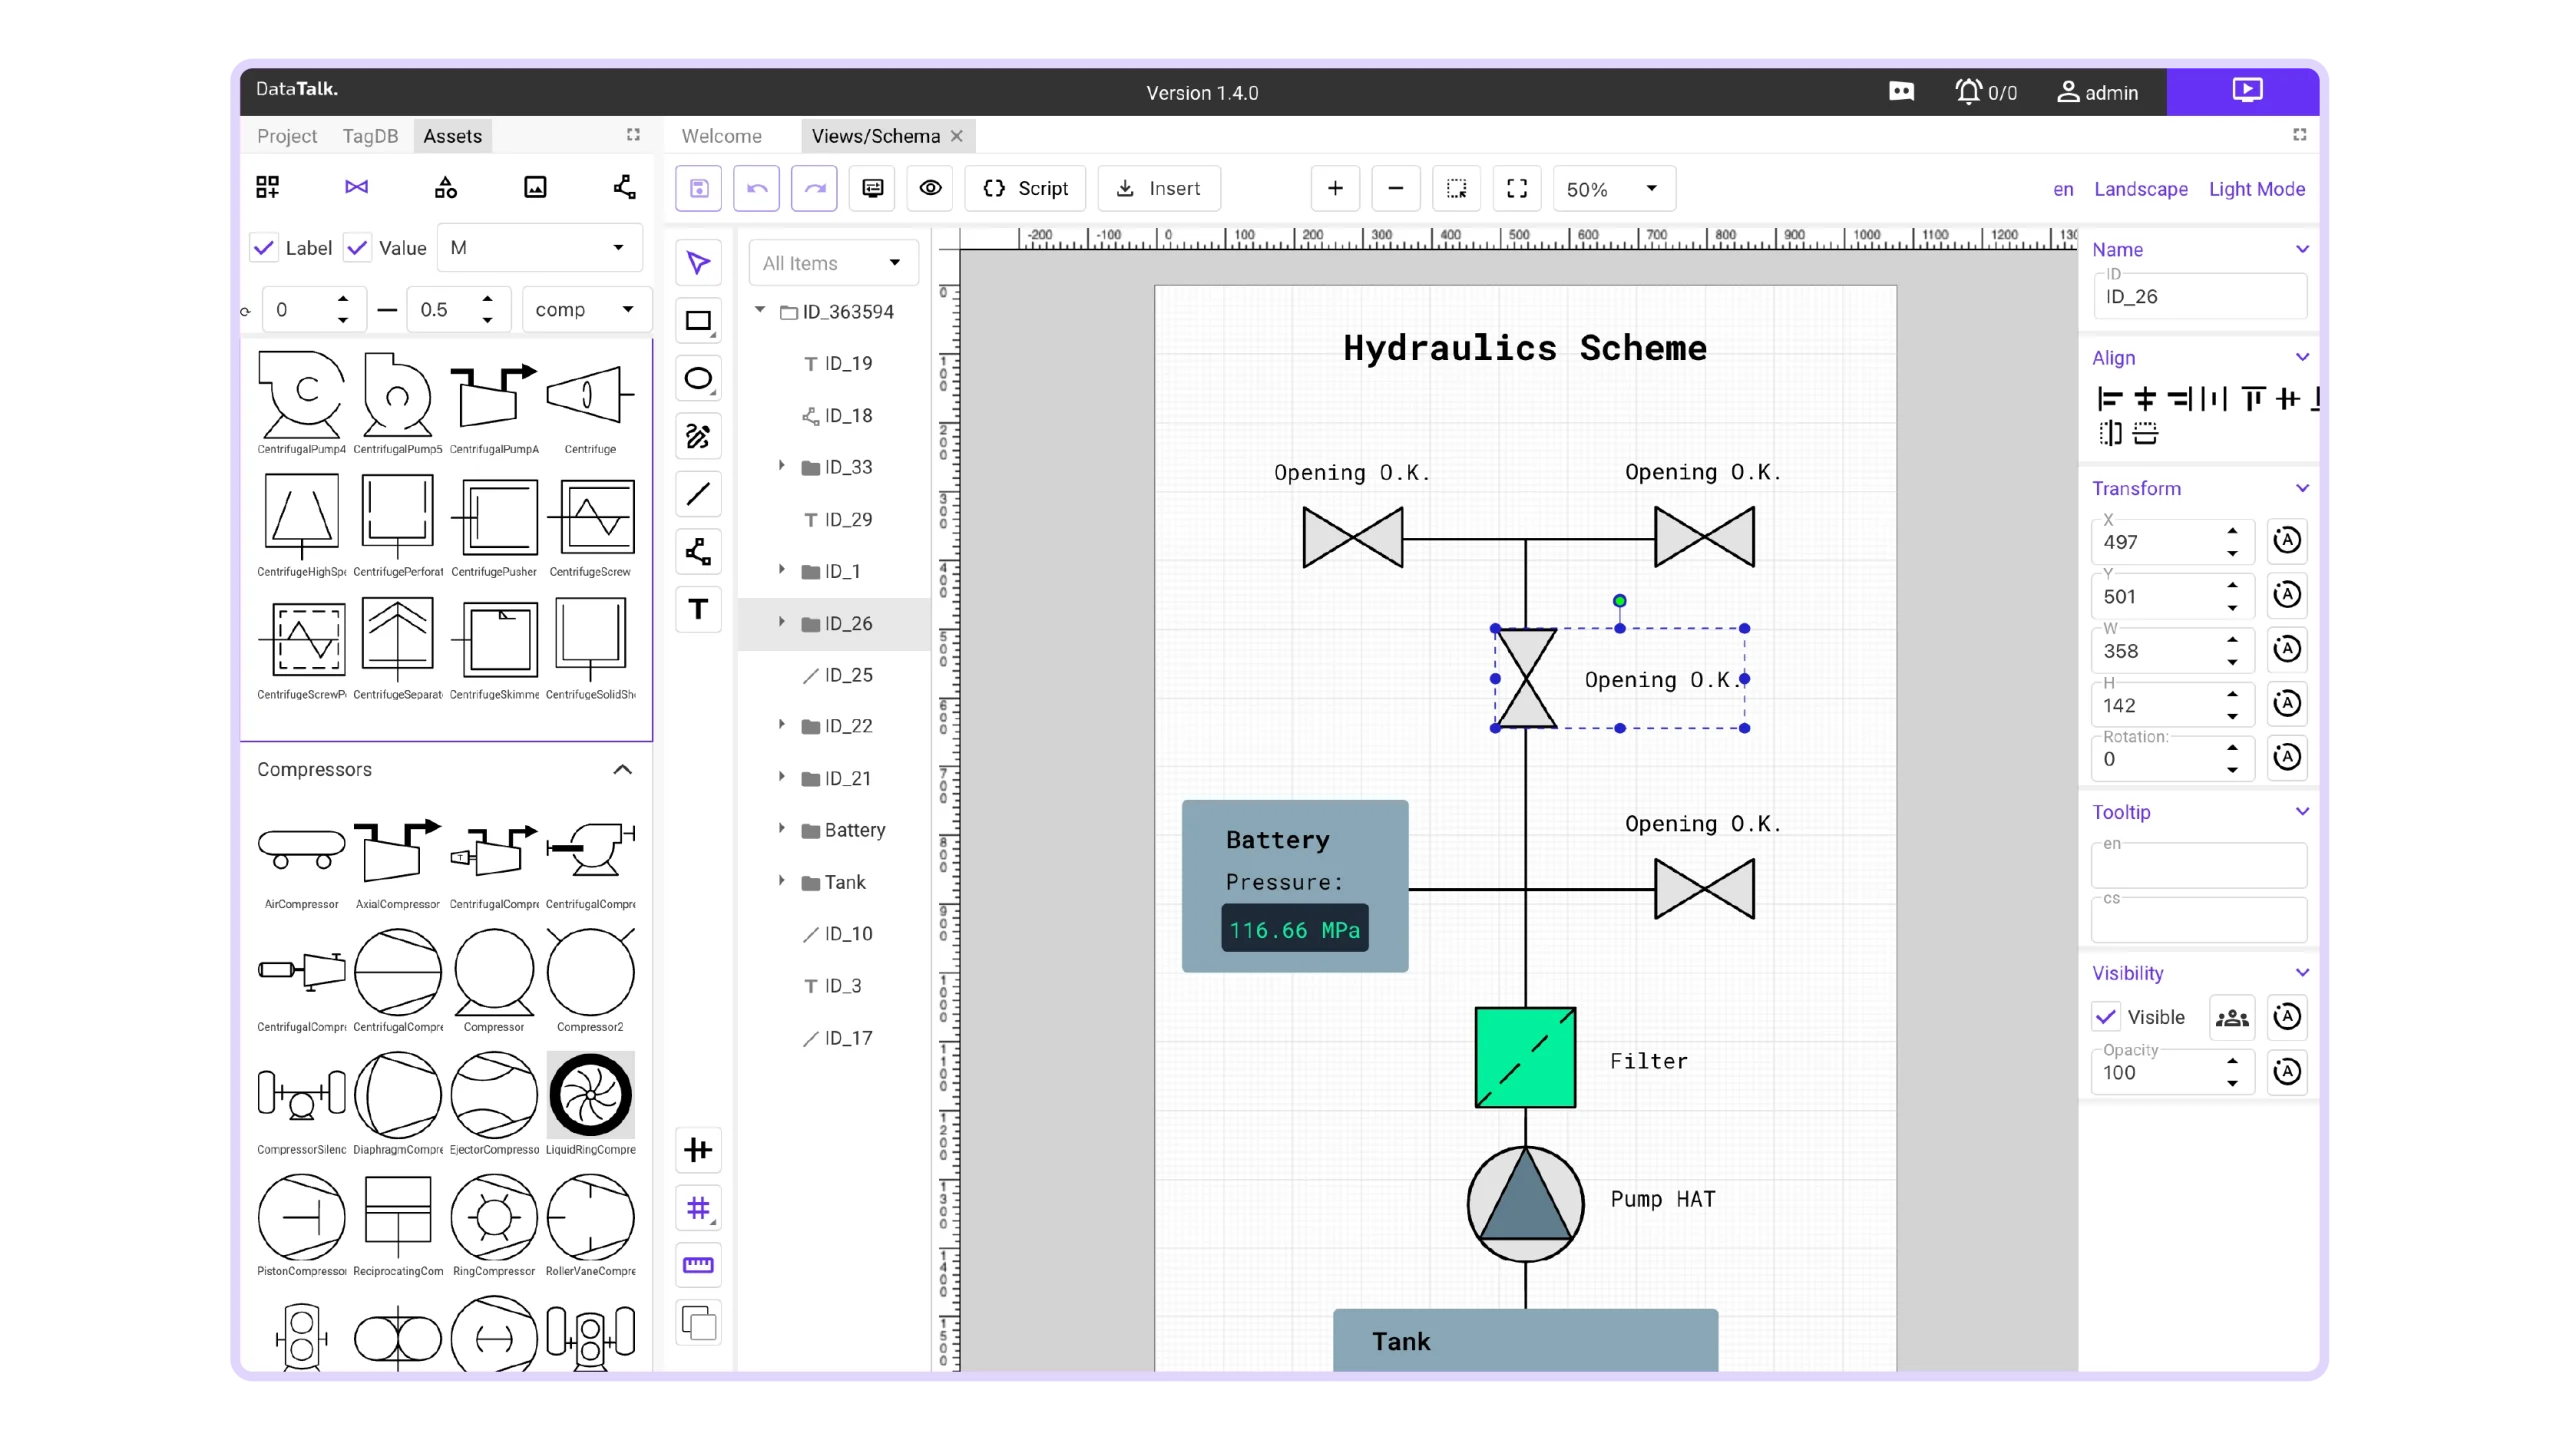
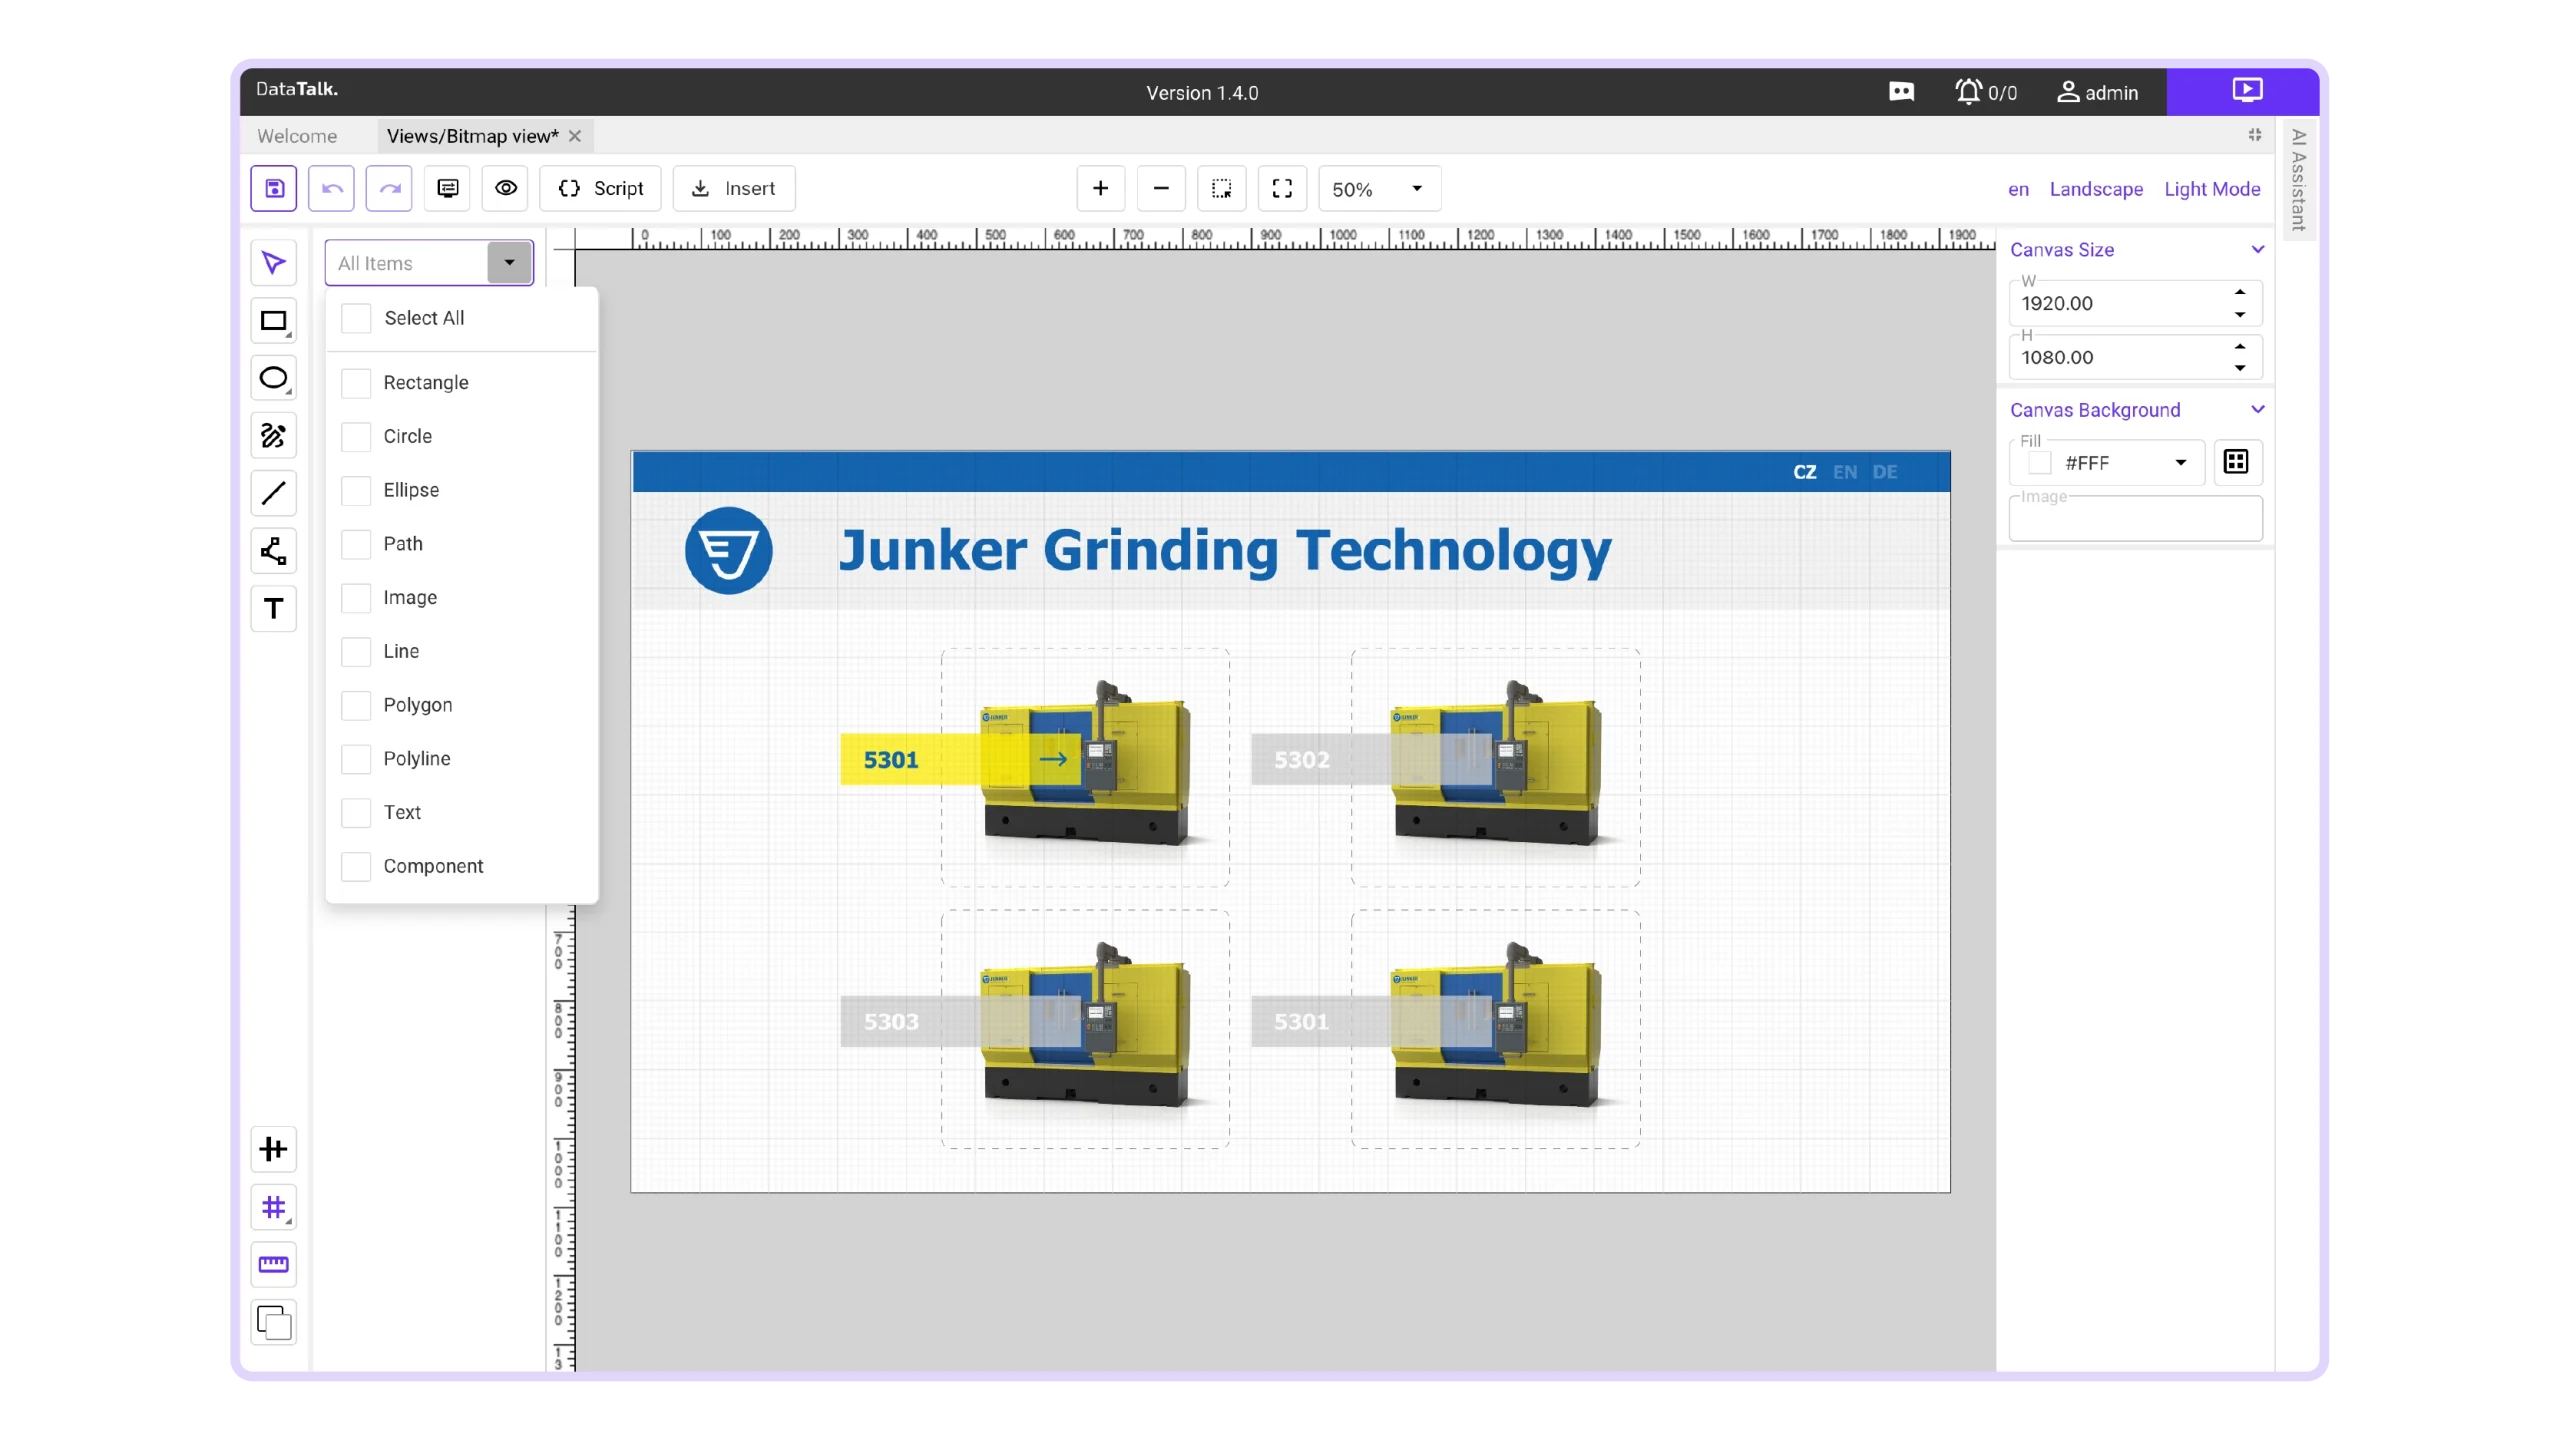
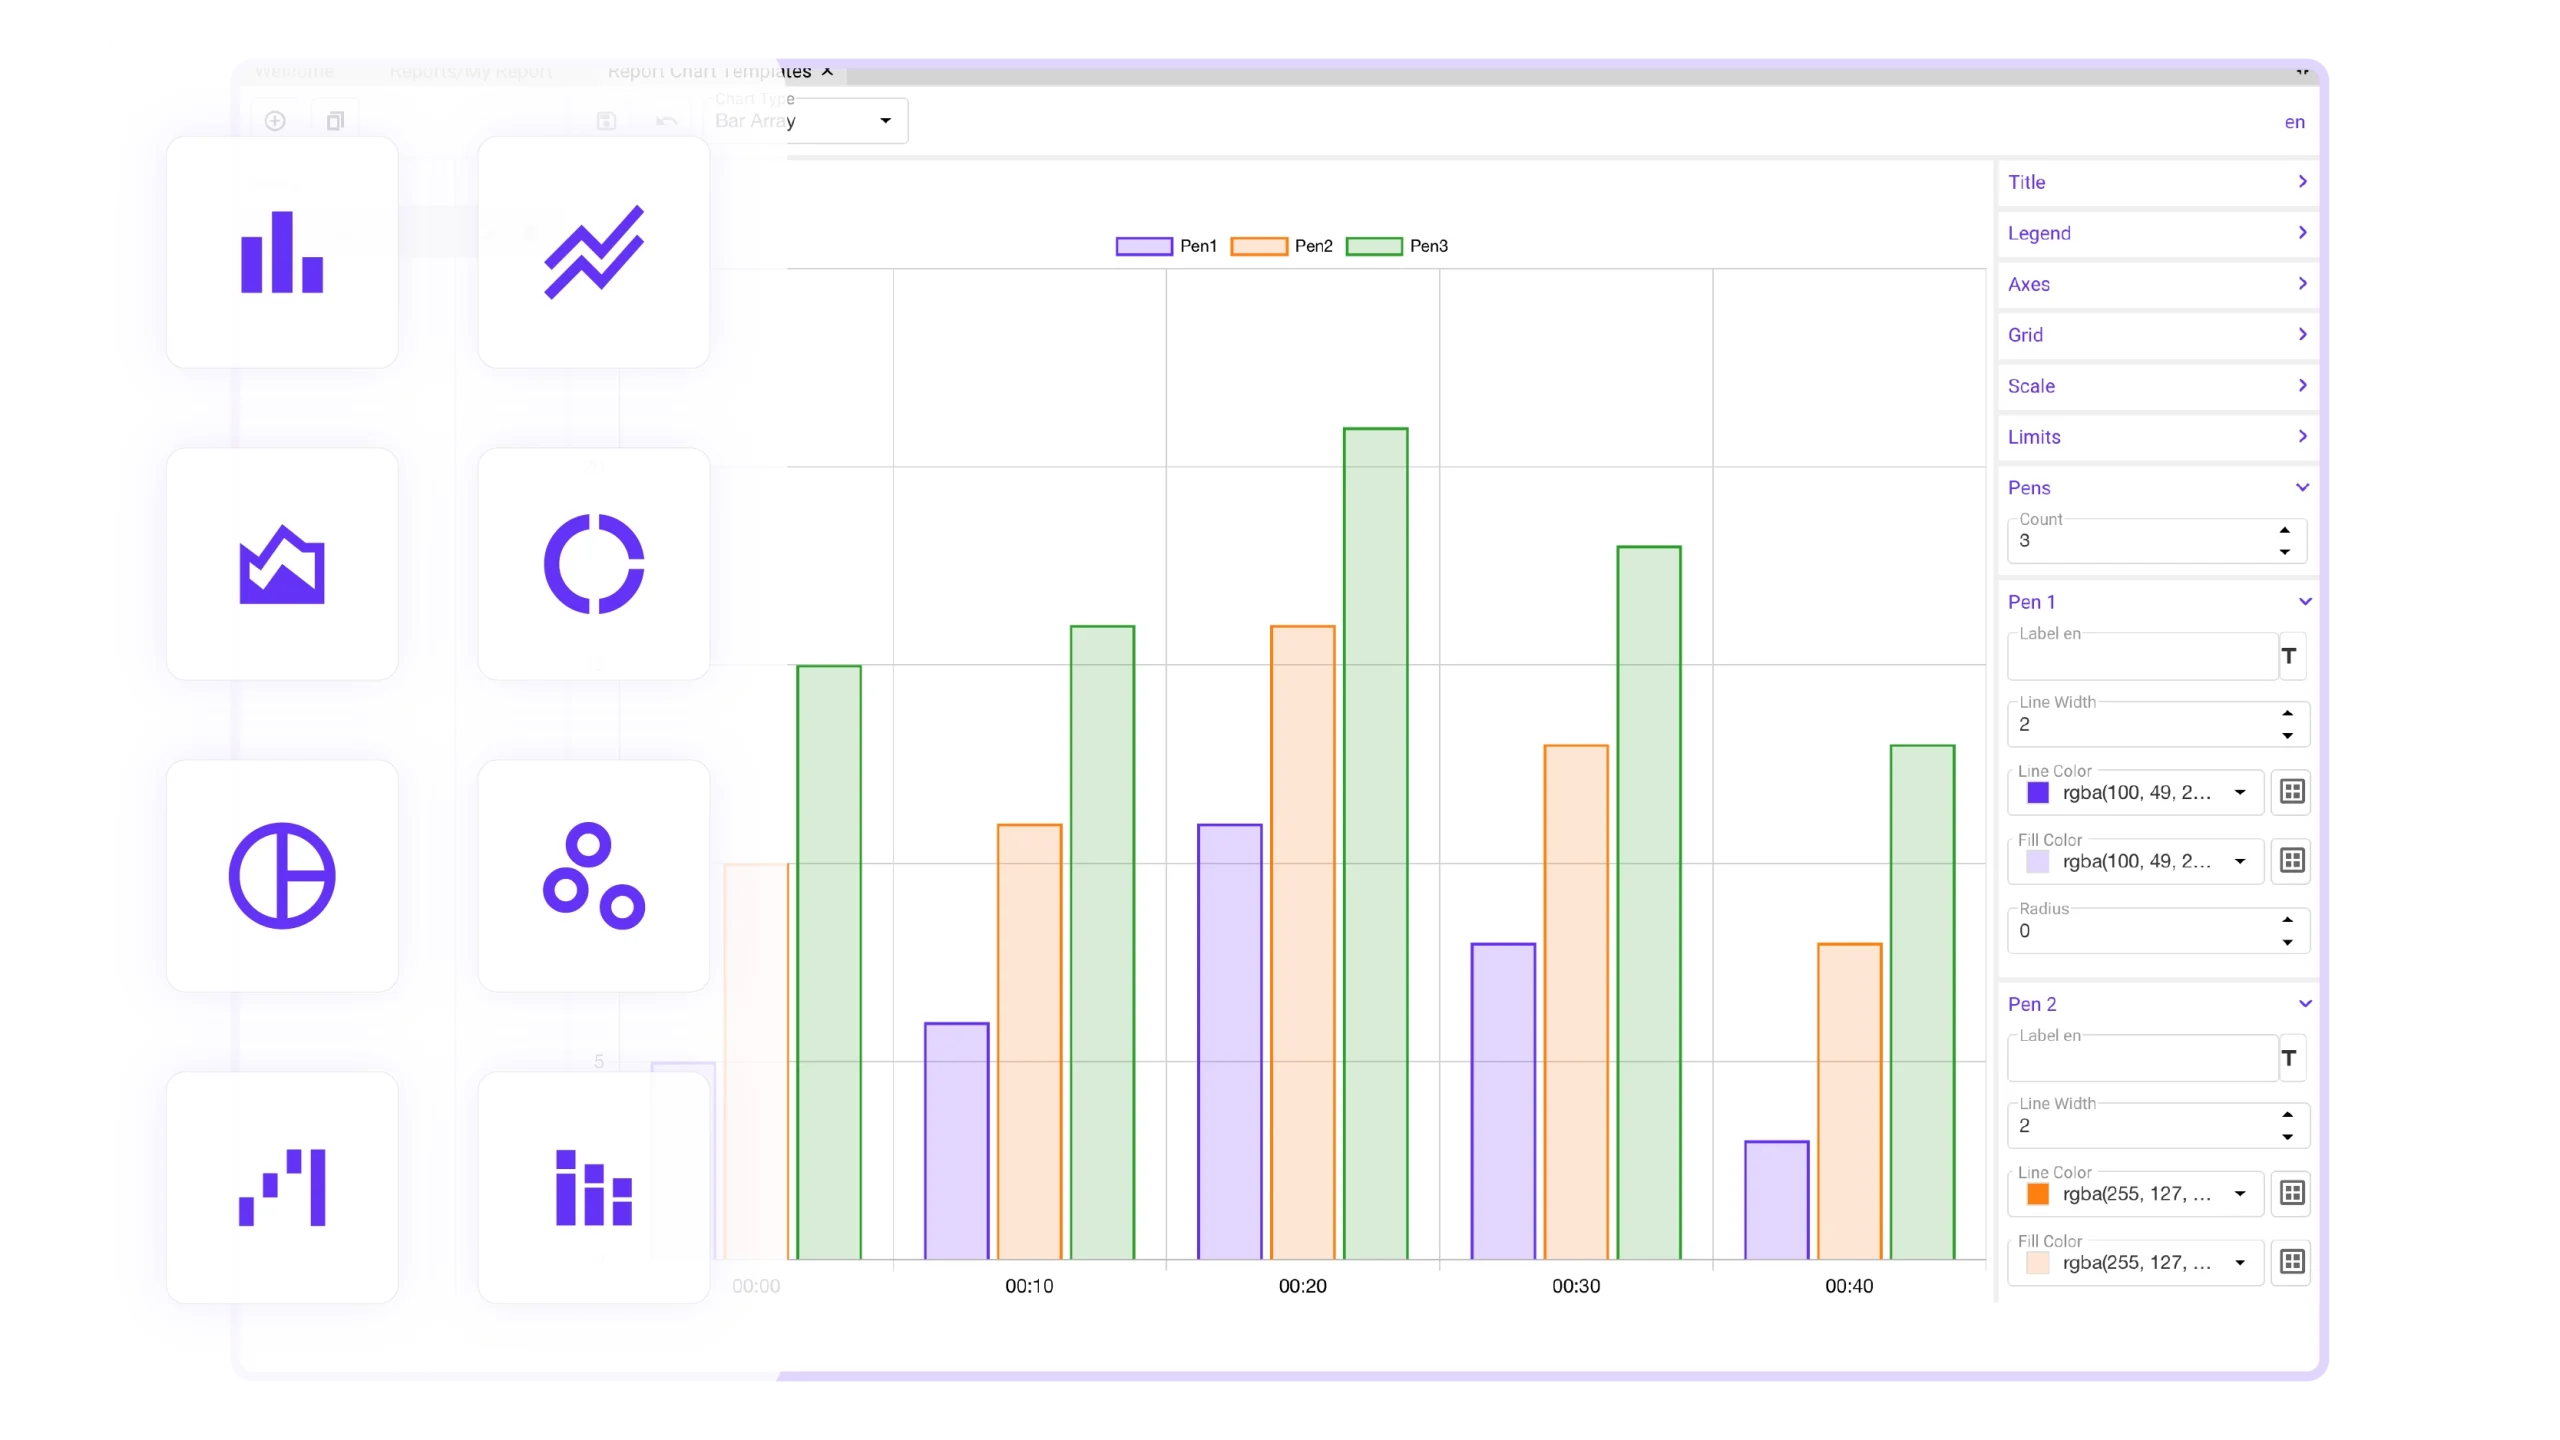
Create comprehensive operator interfaces with real-time data, alarms, trends, dashboards, reporting, and AI, all within one unified HMI environment.
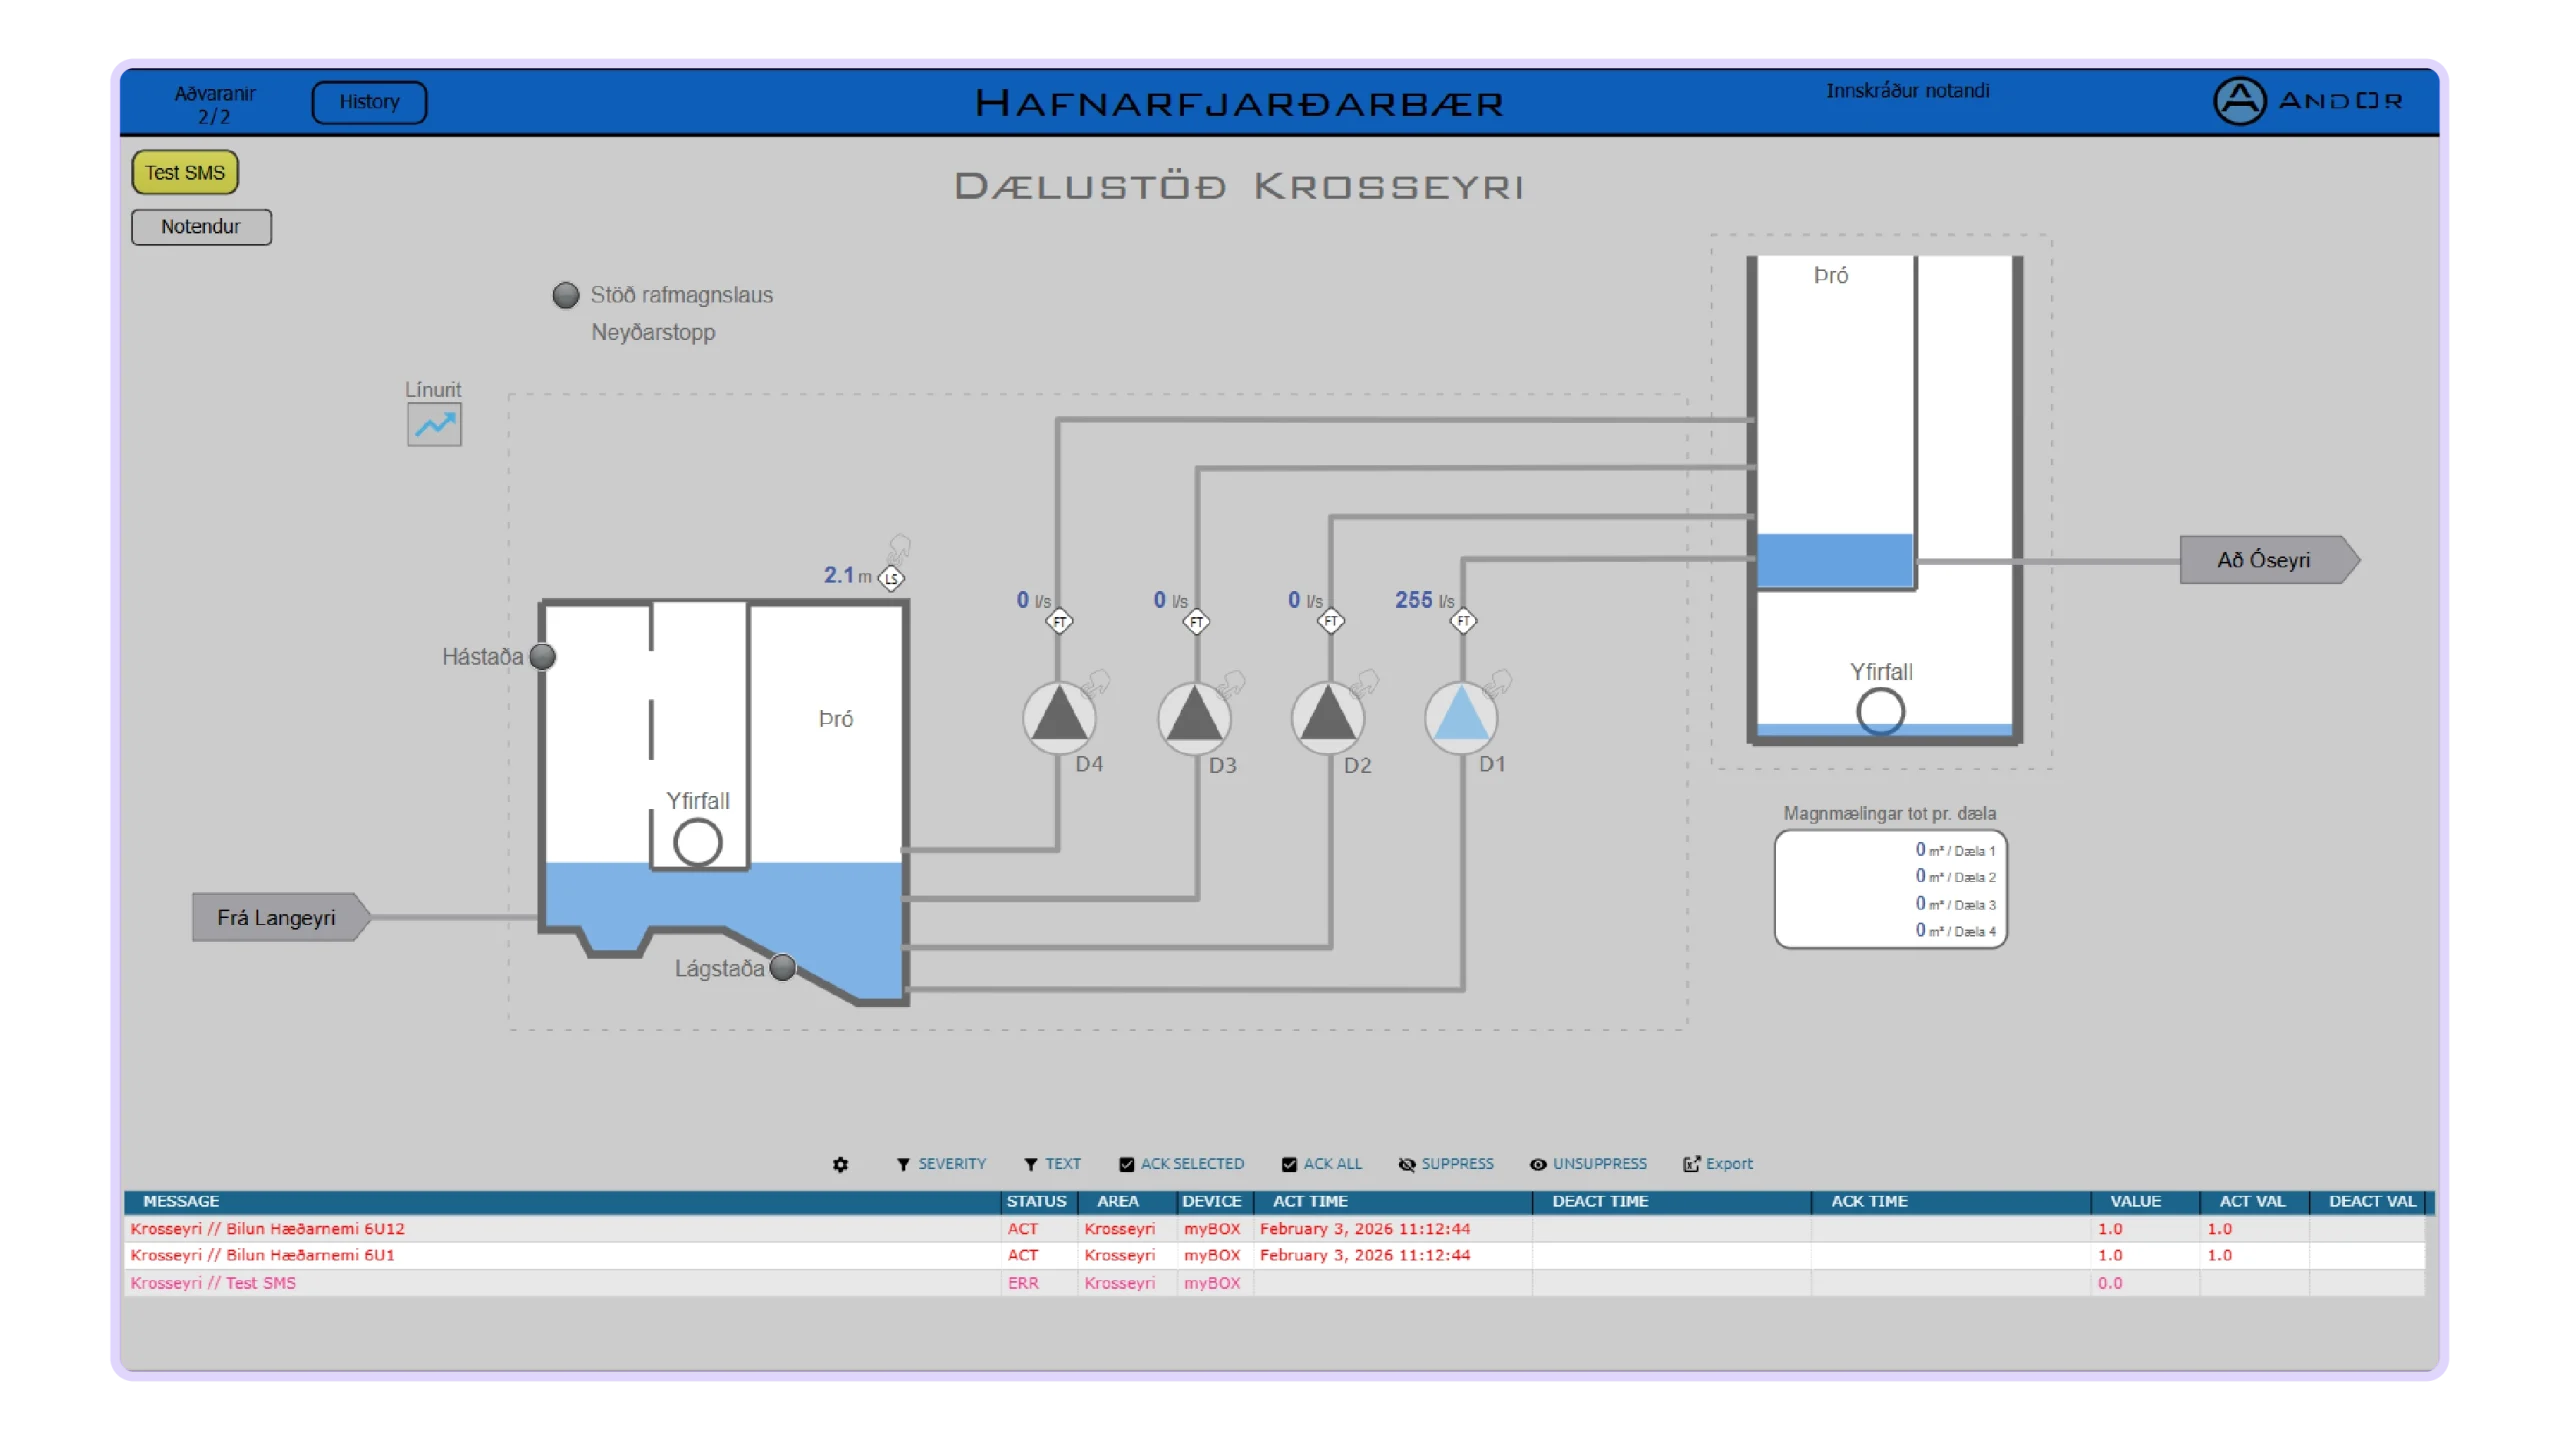
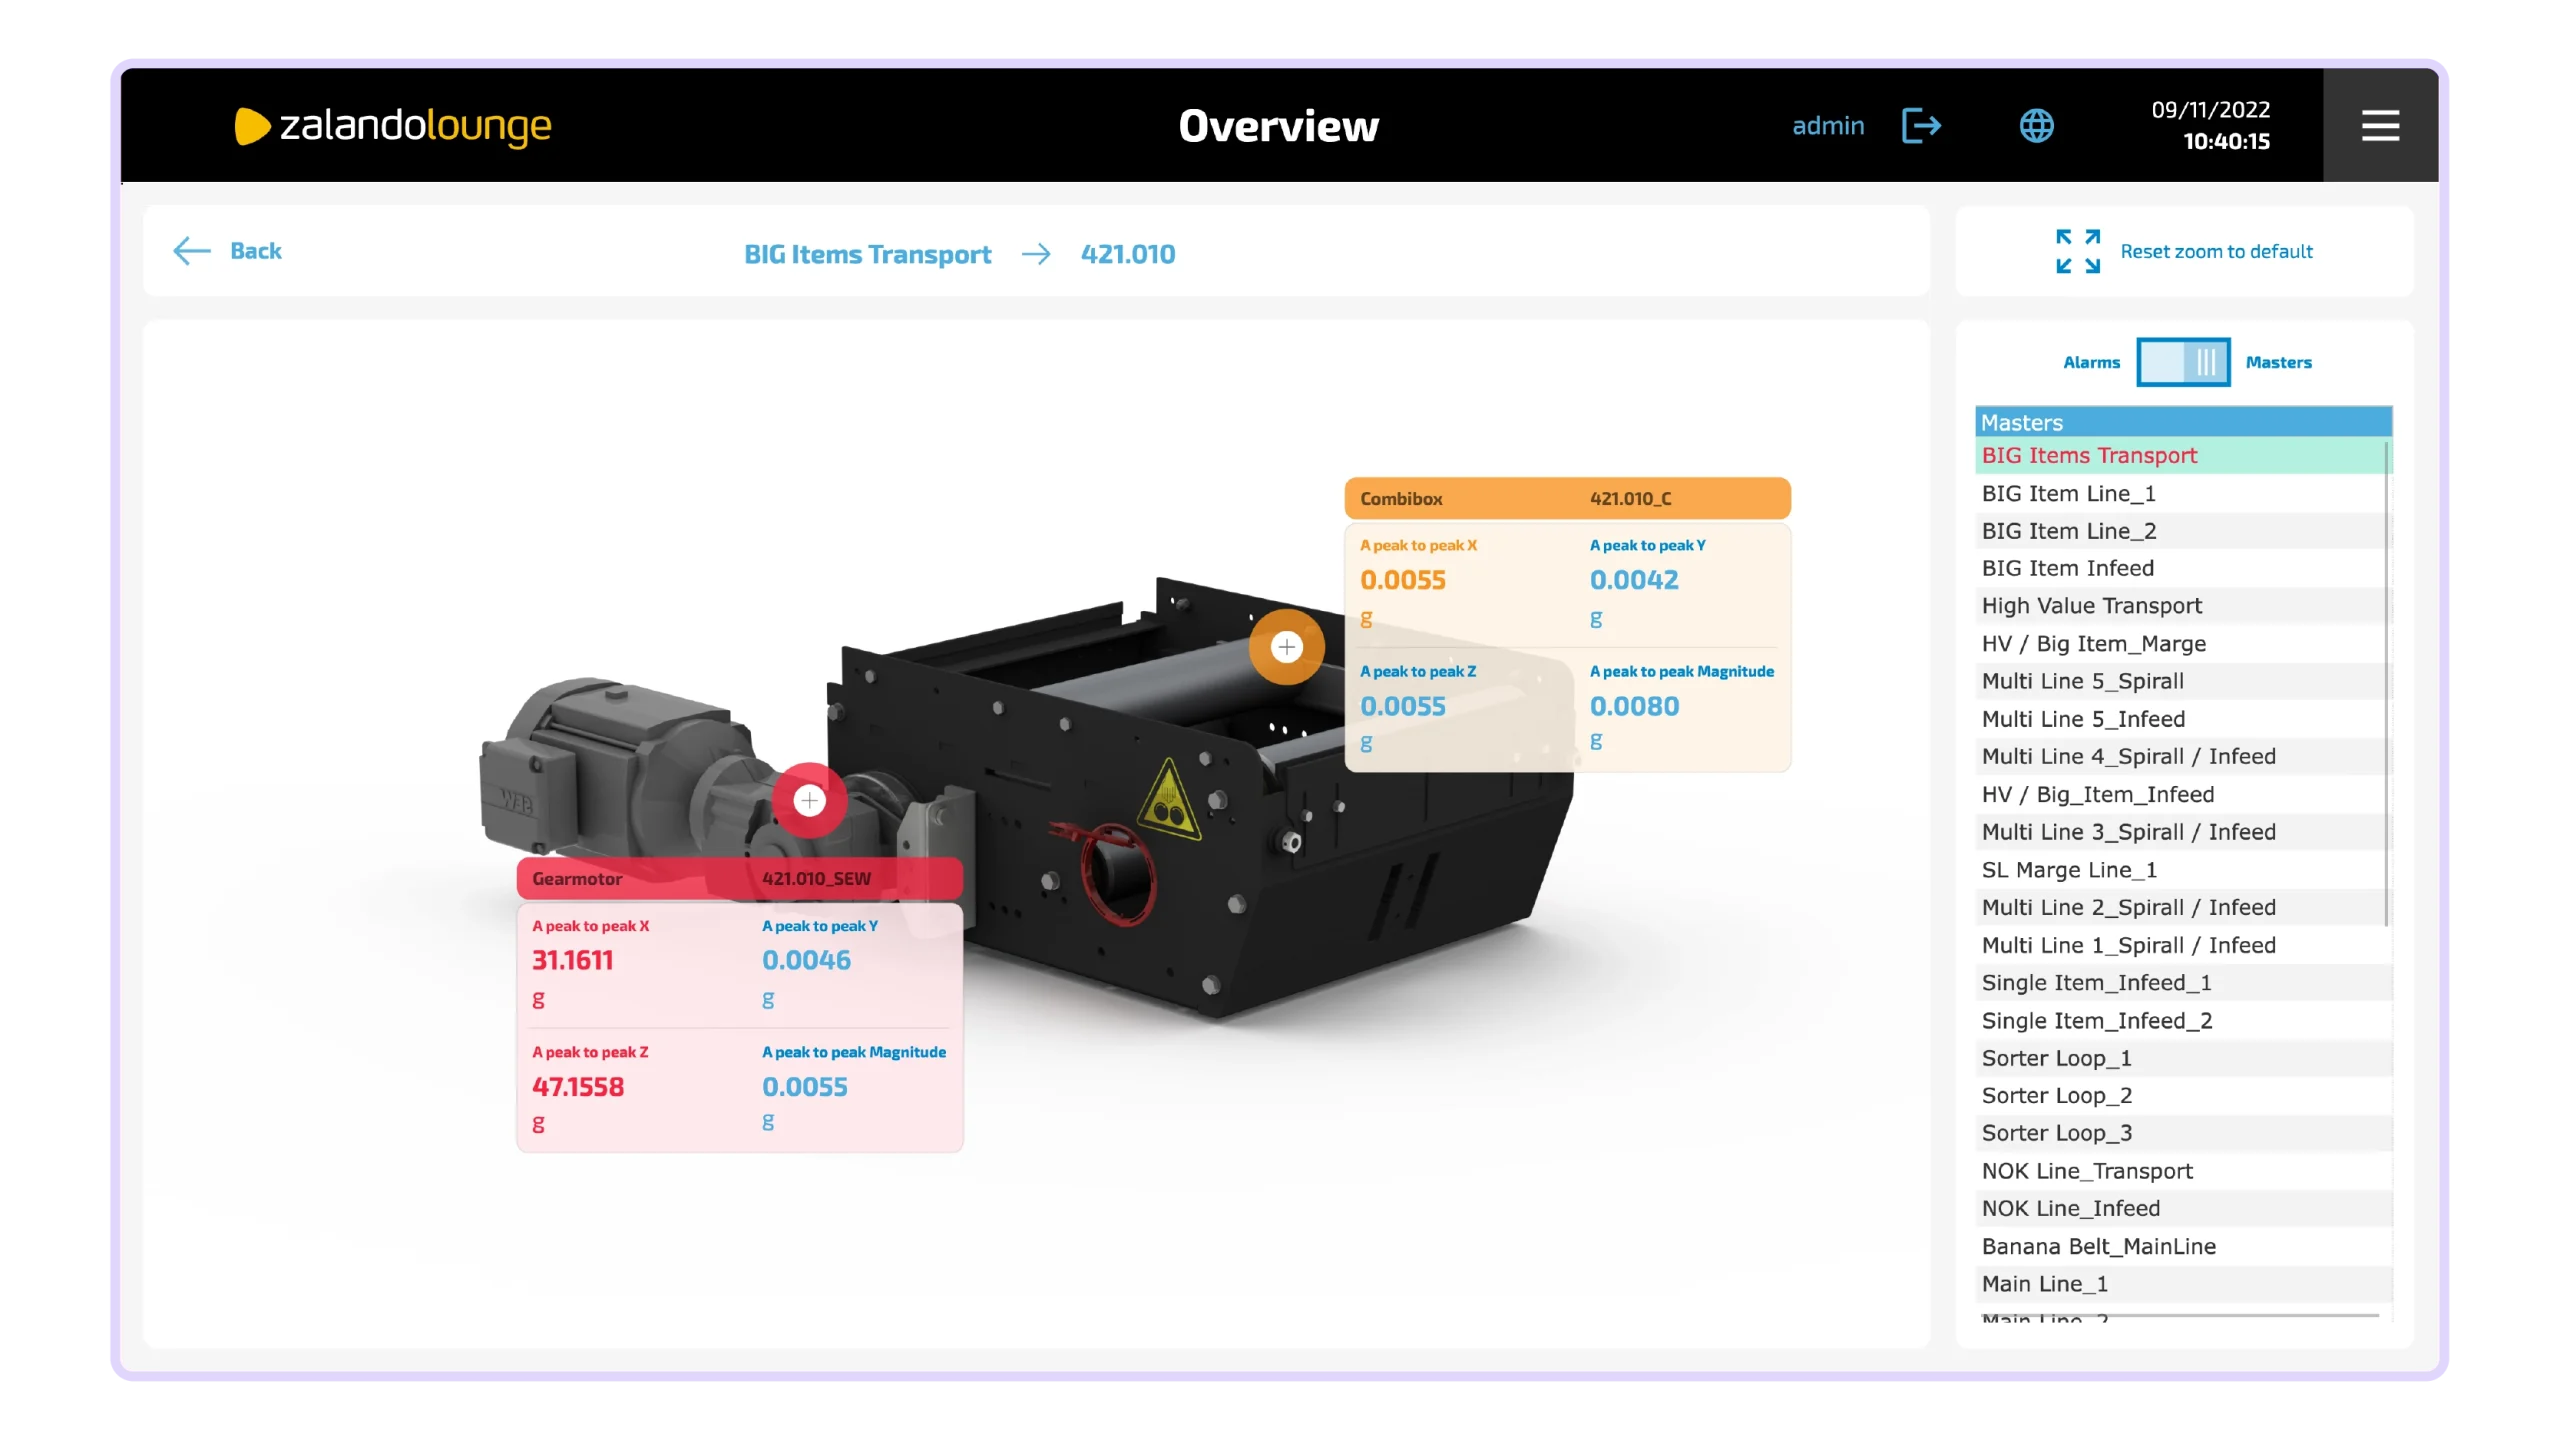
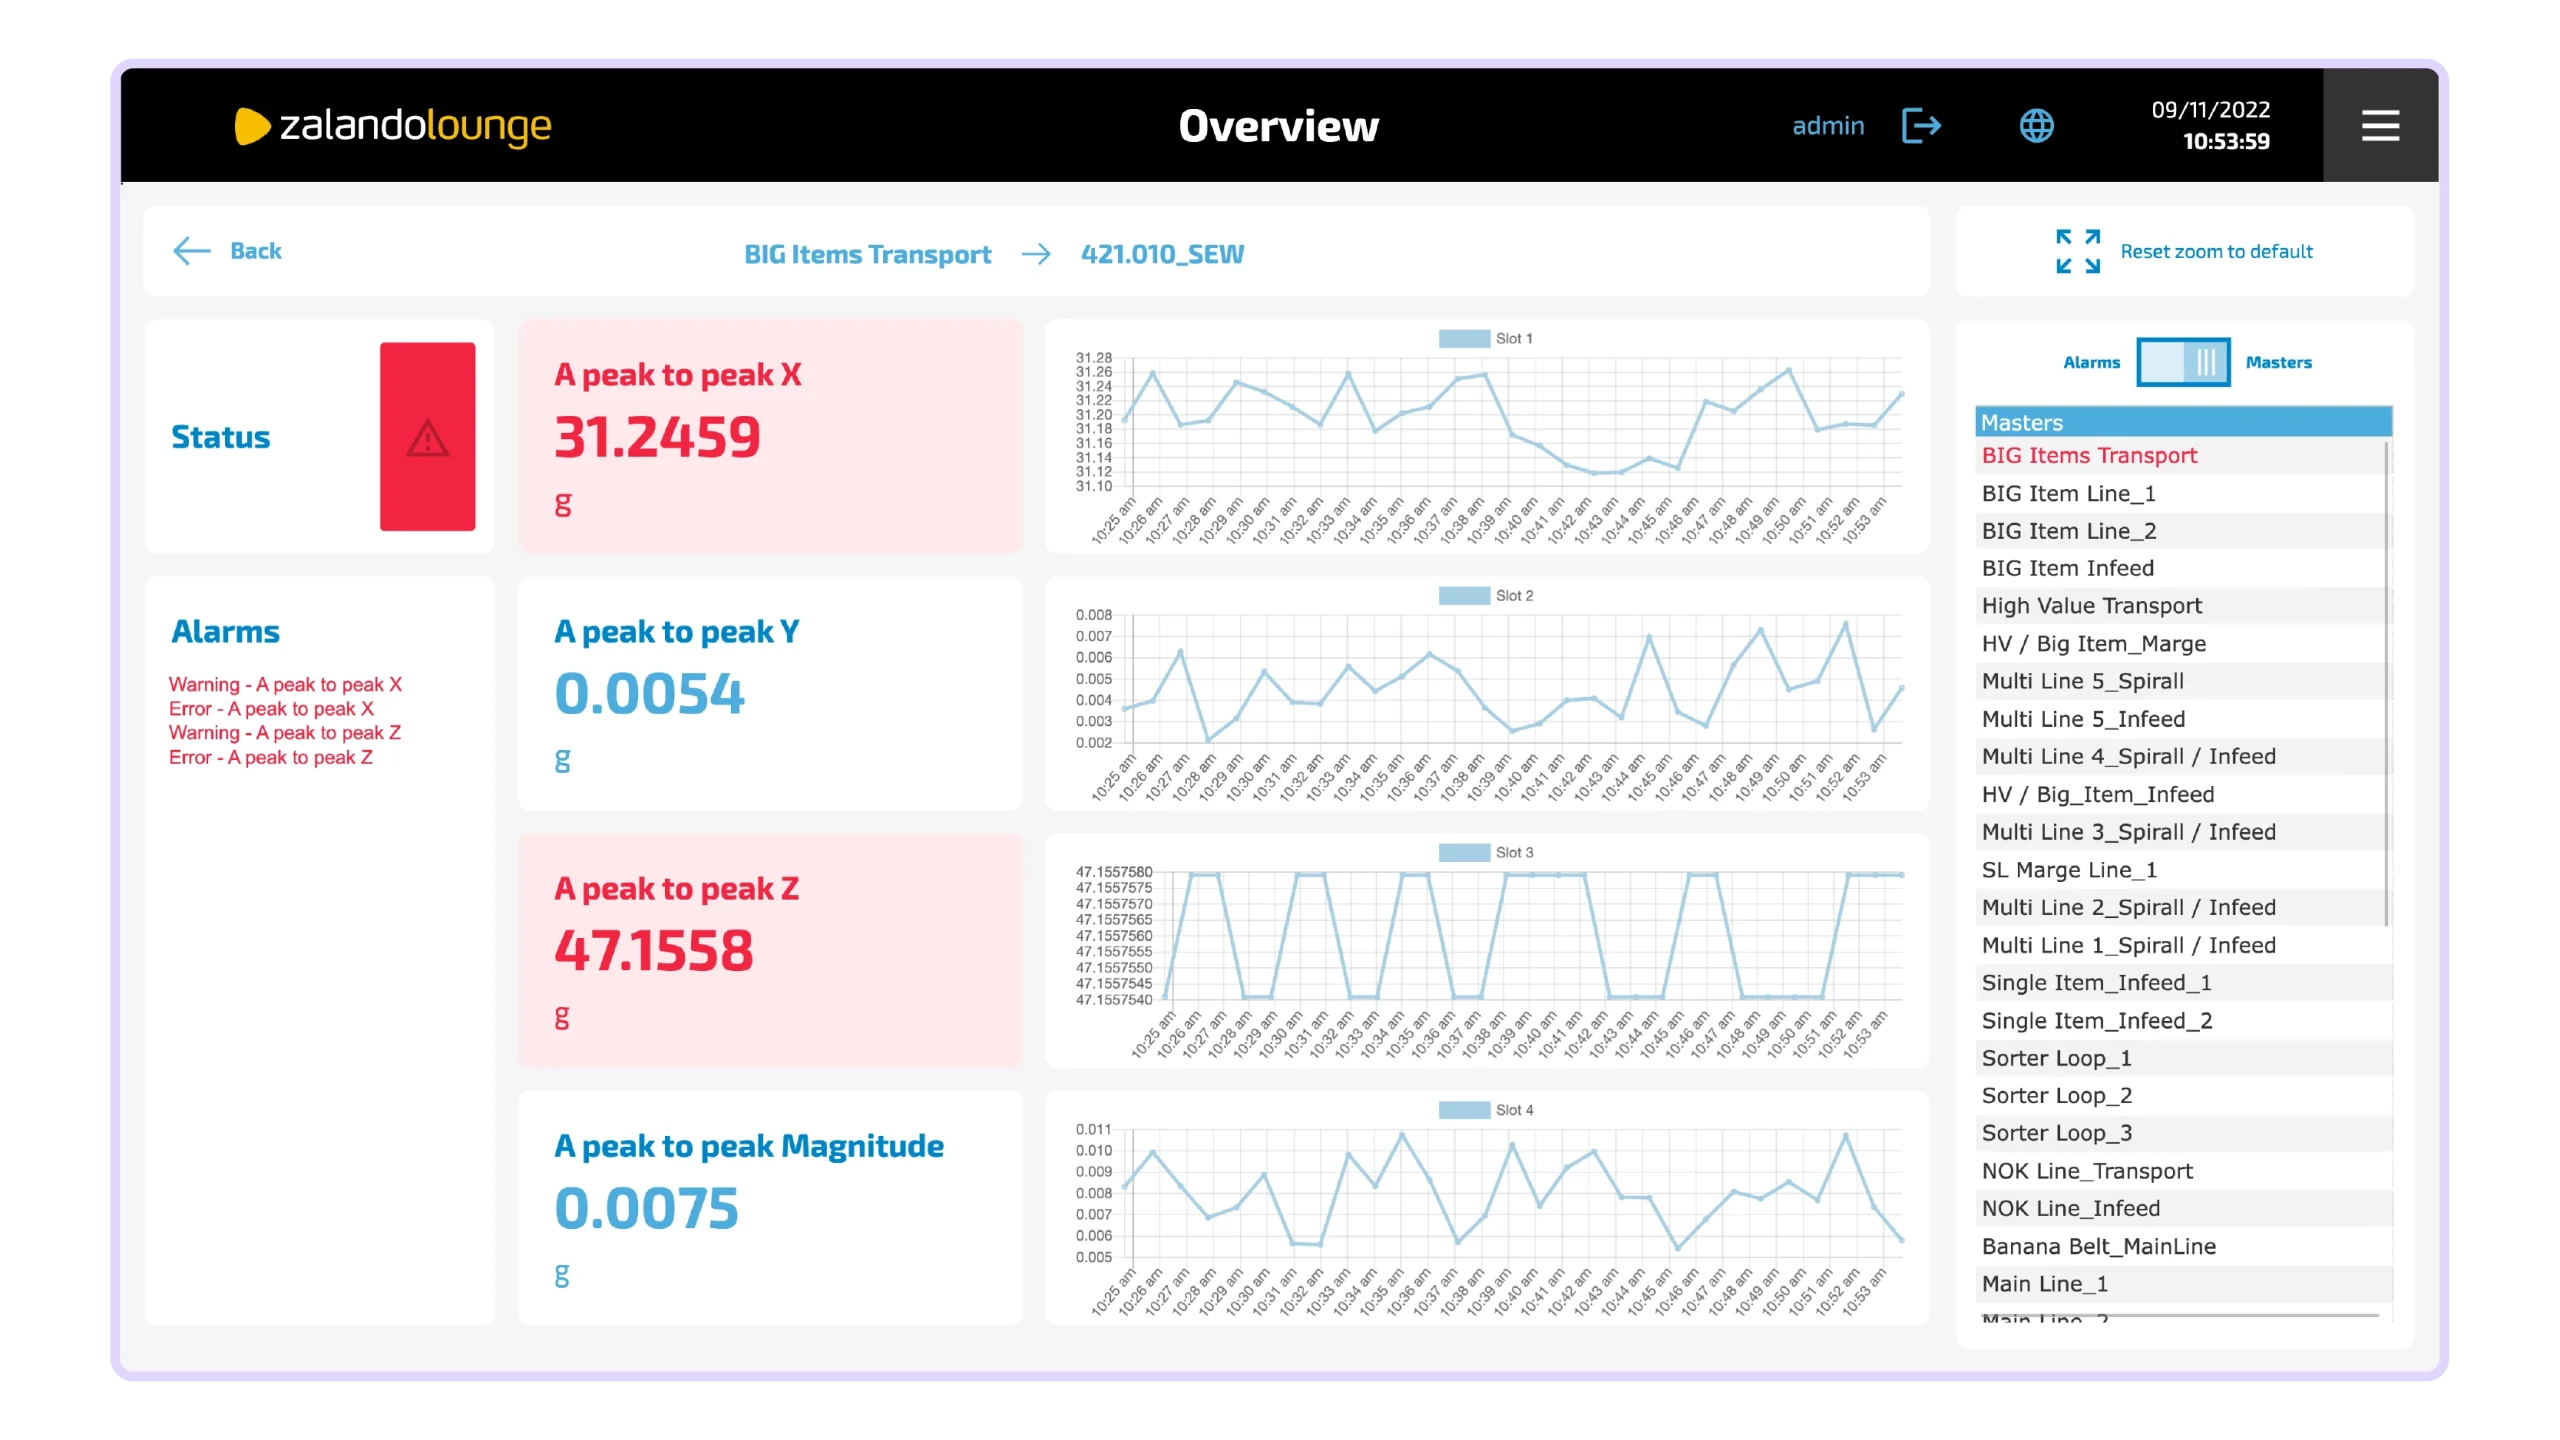
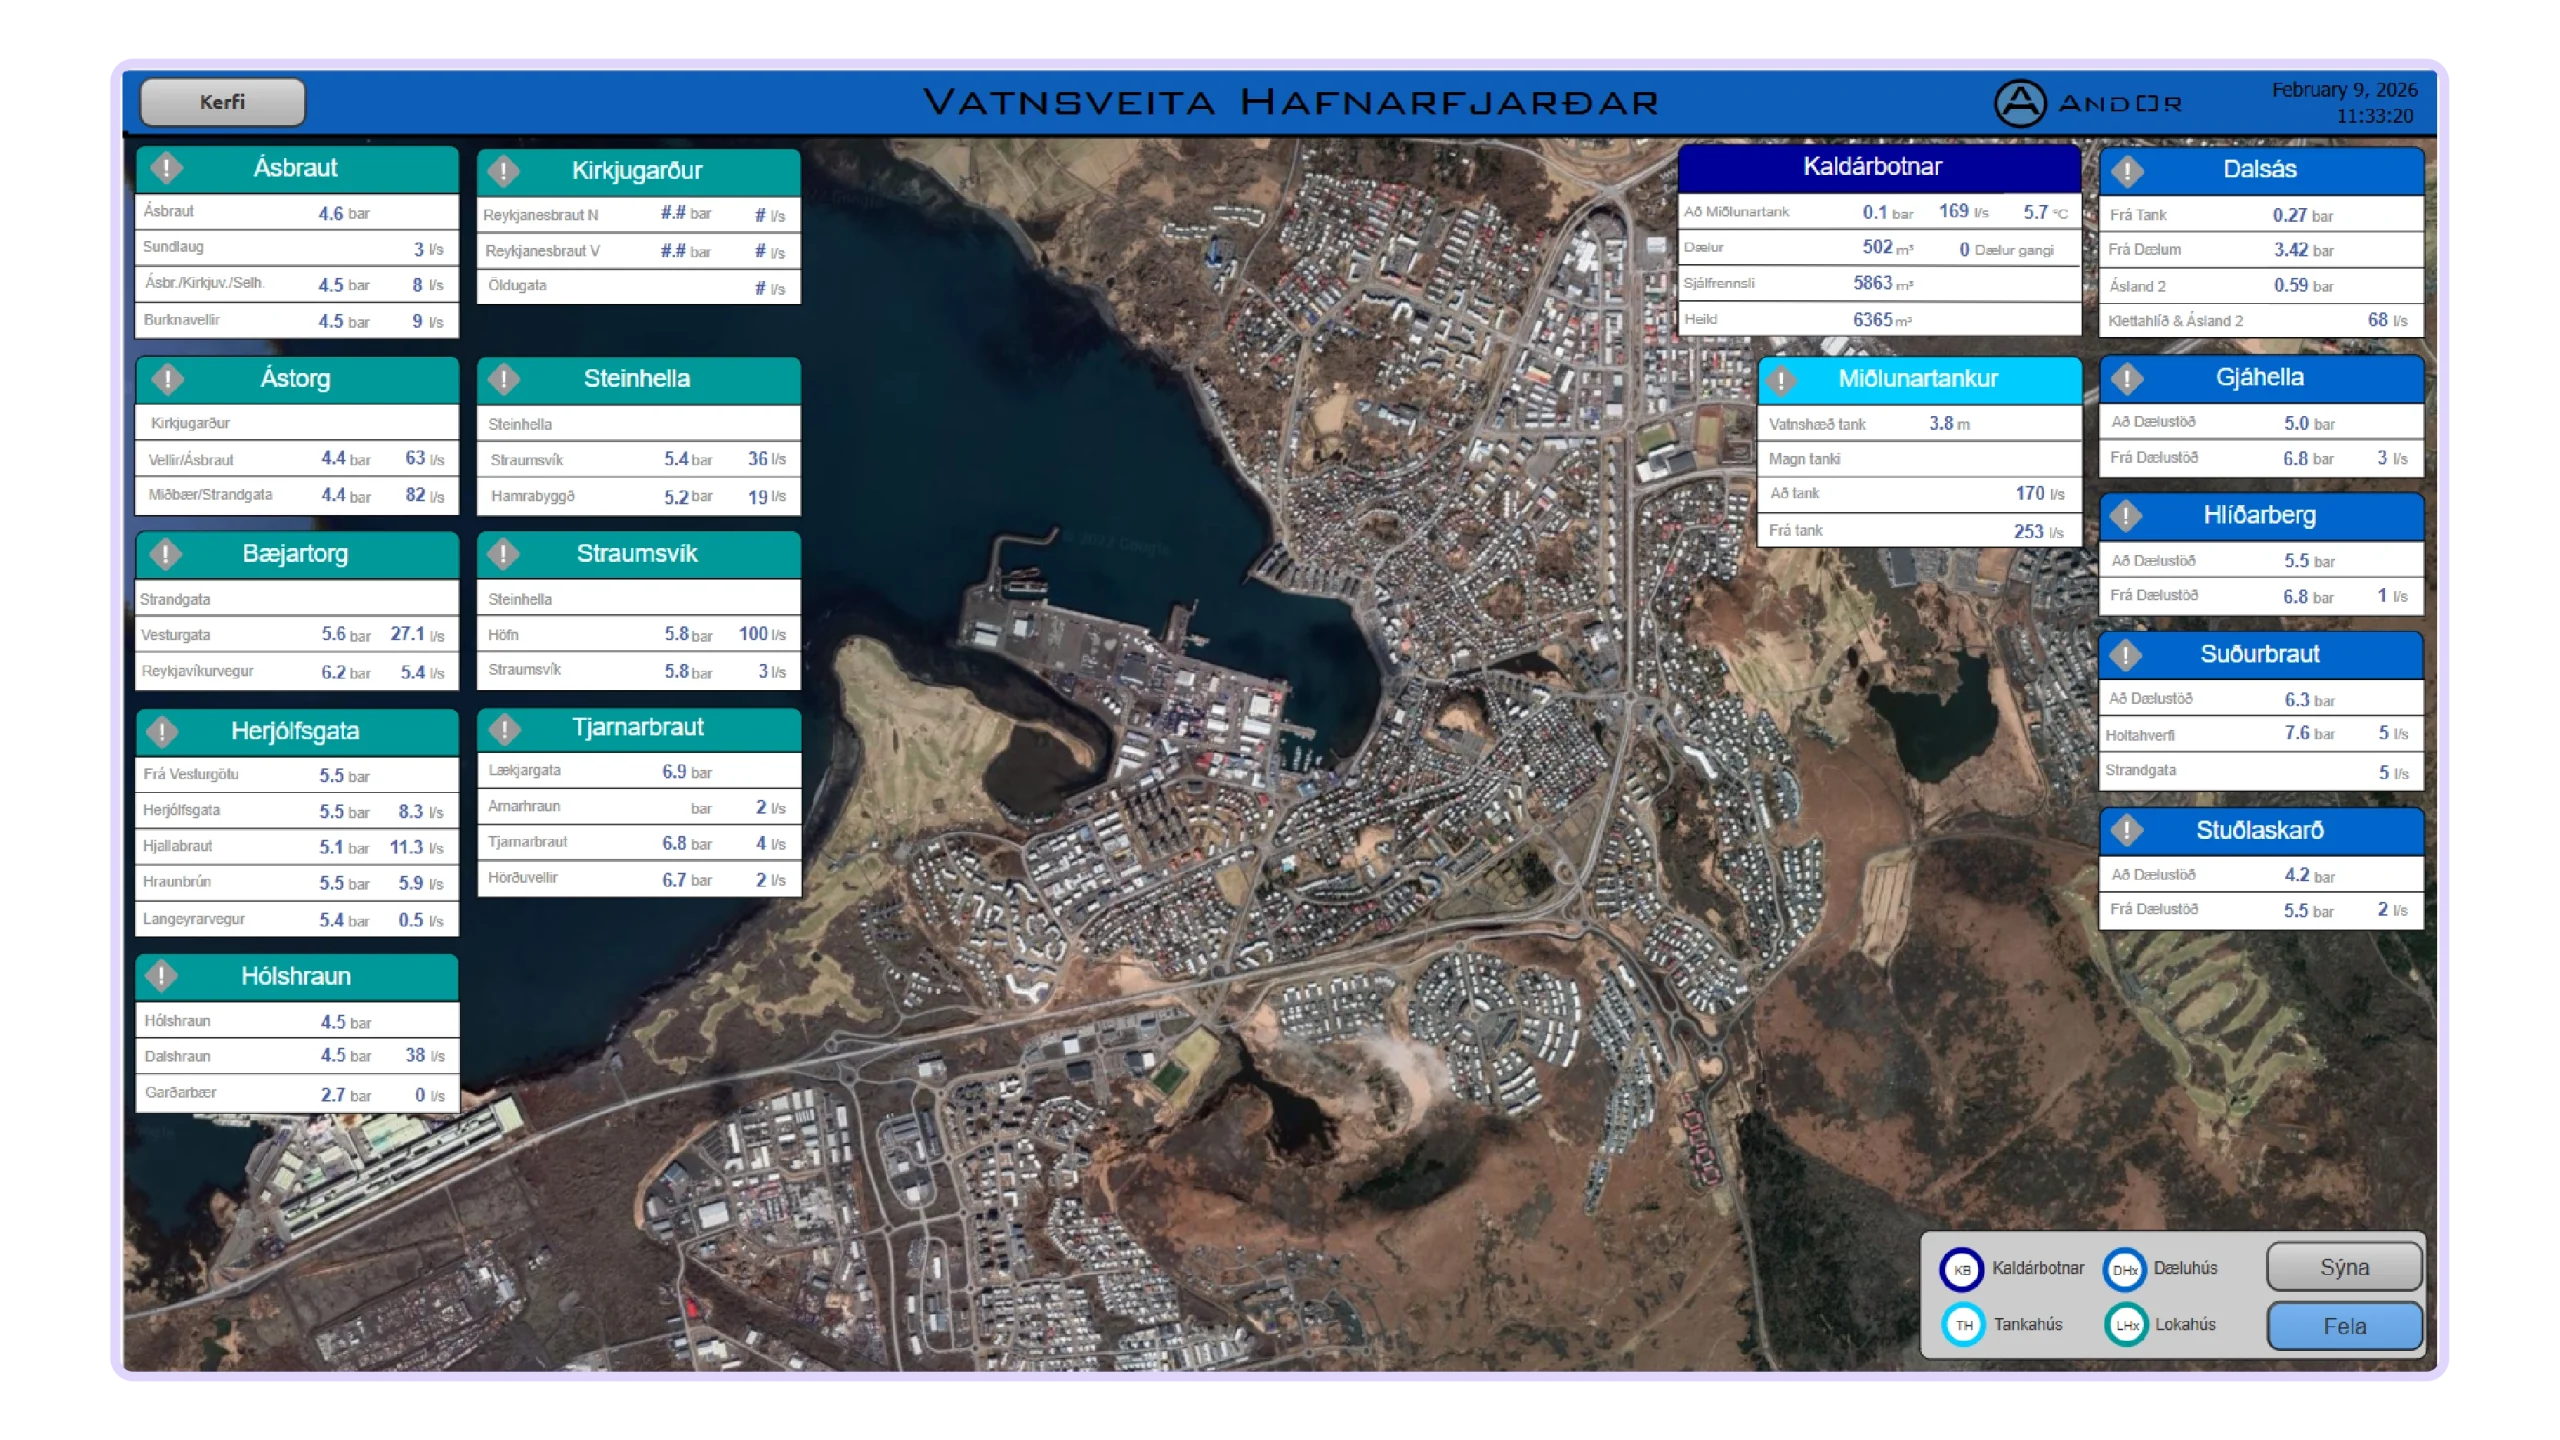
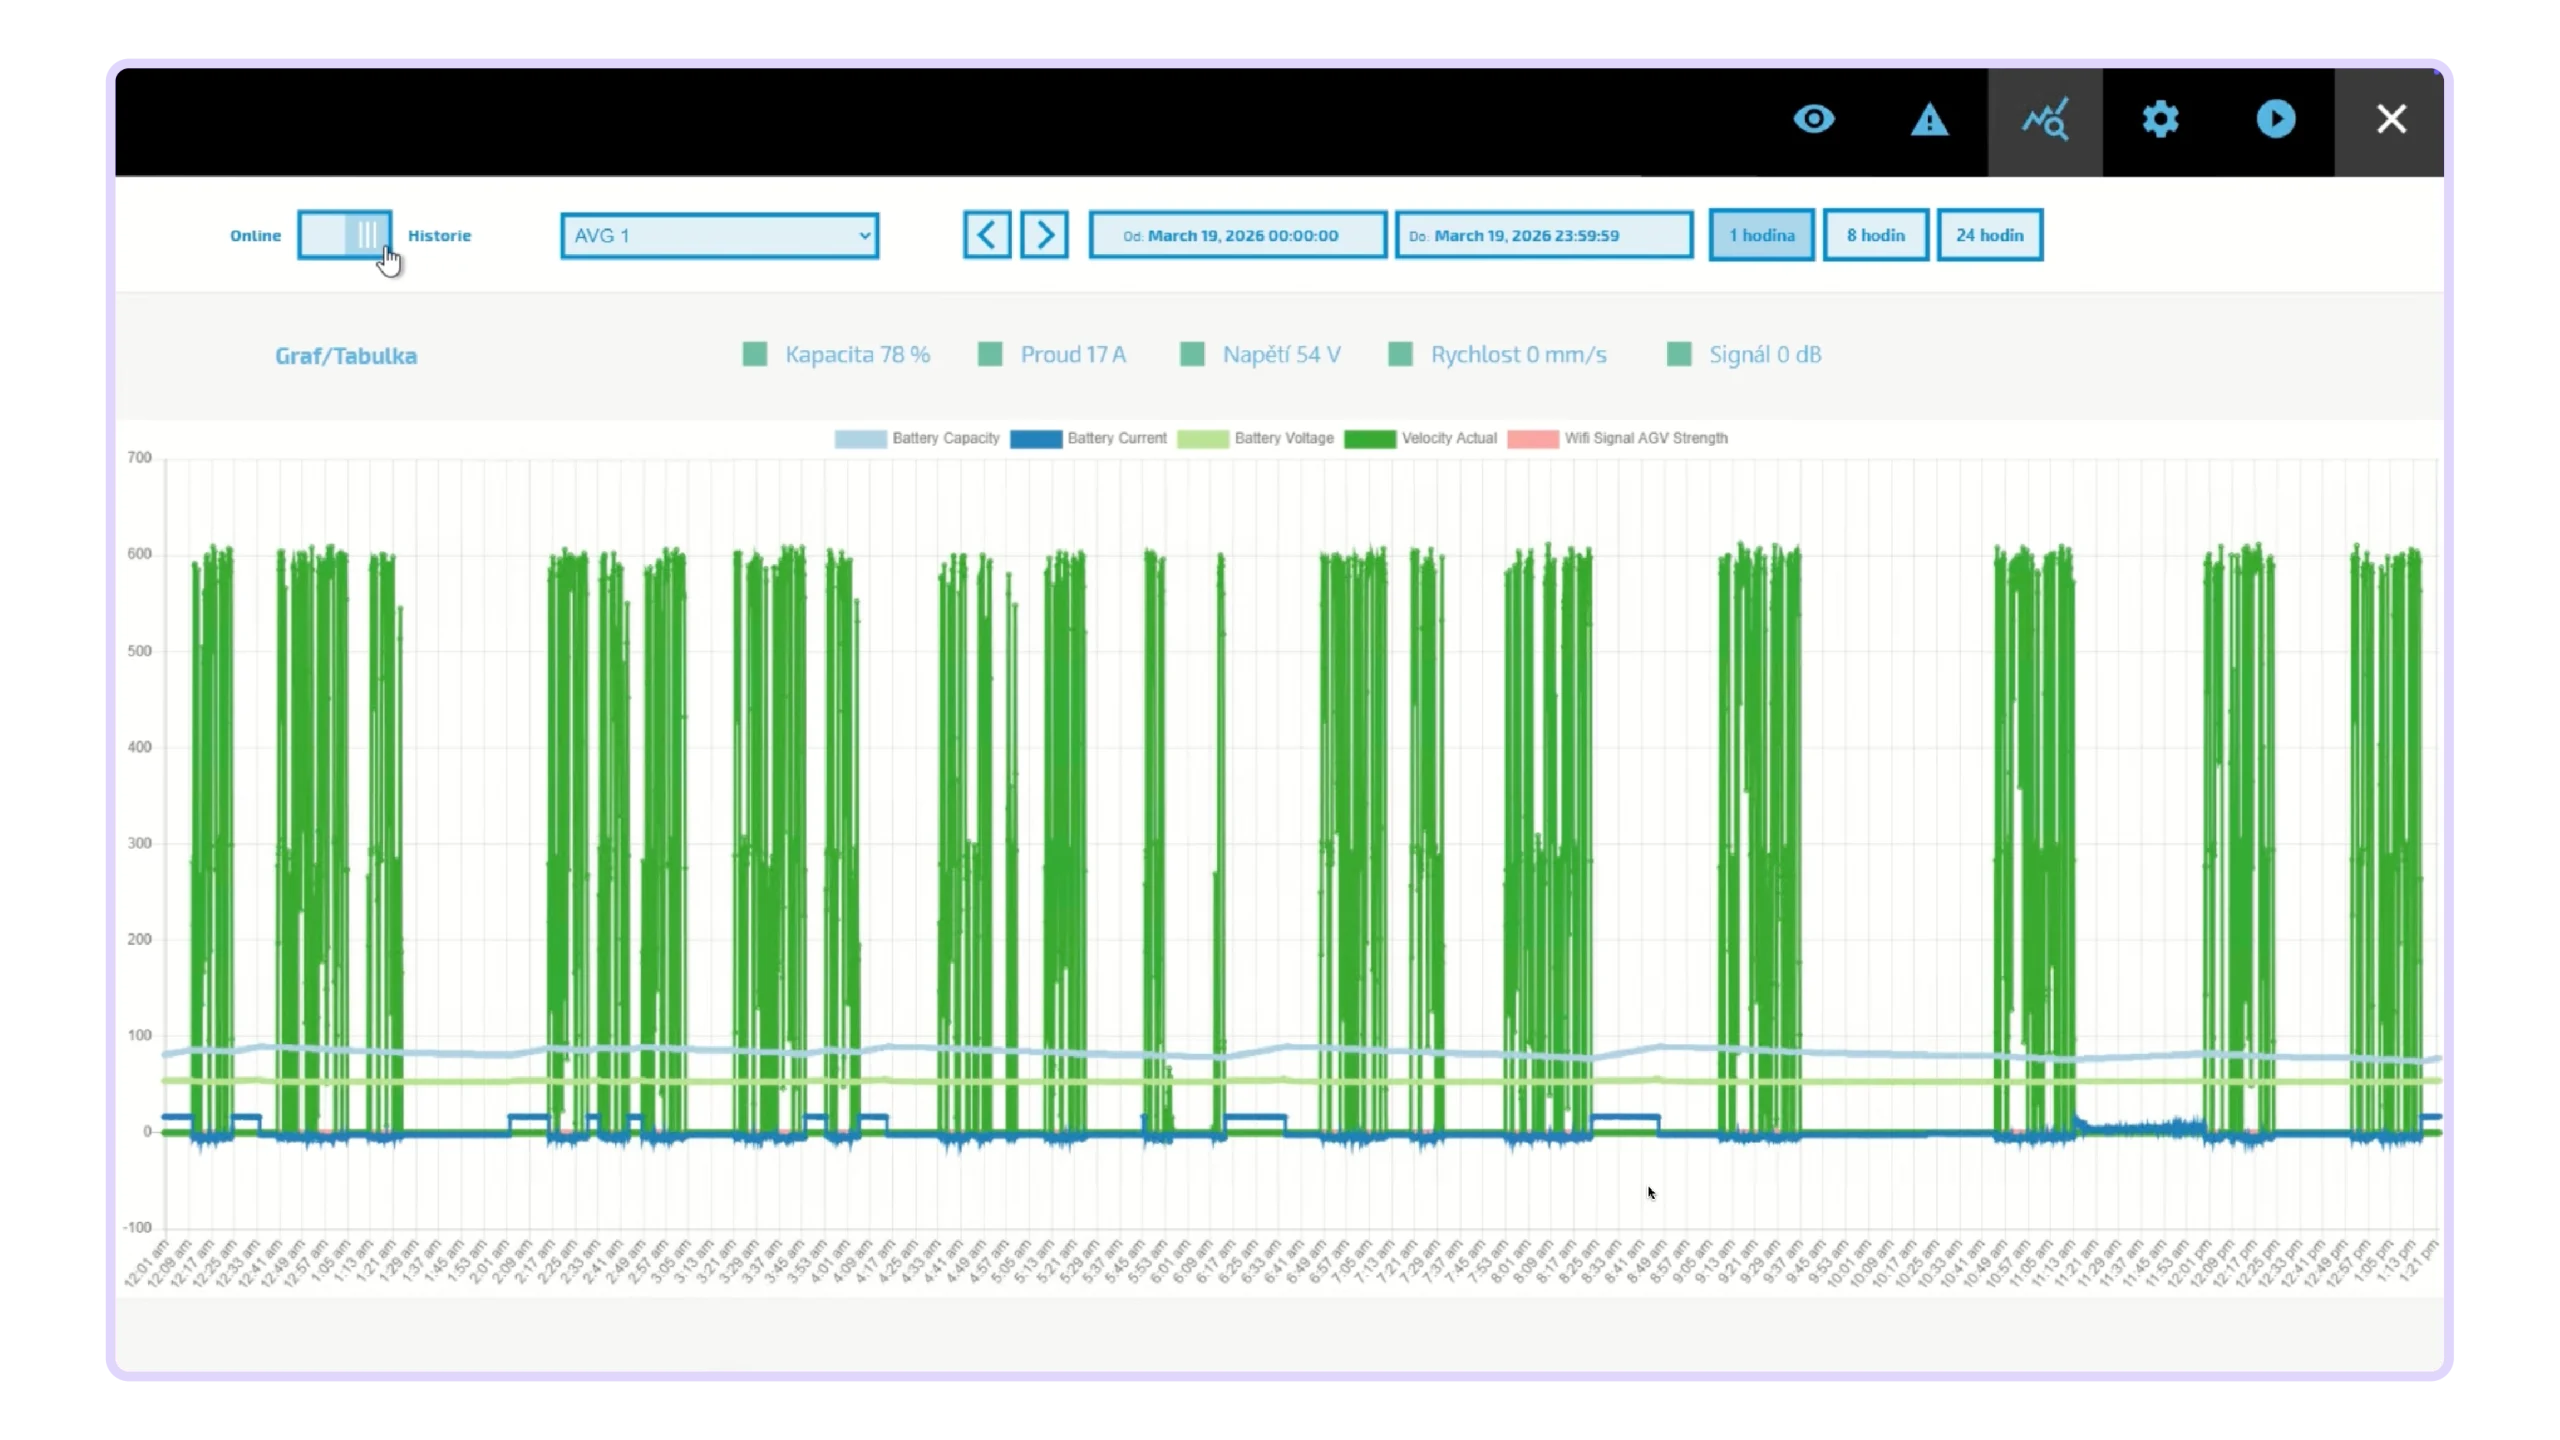
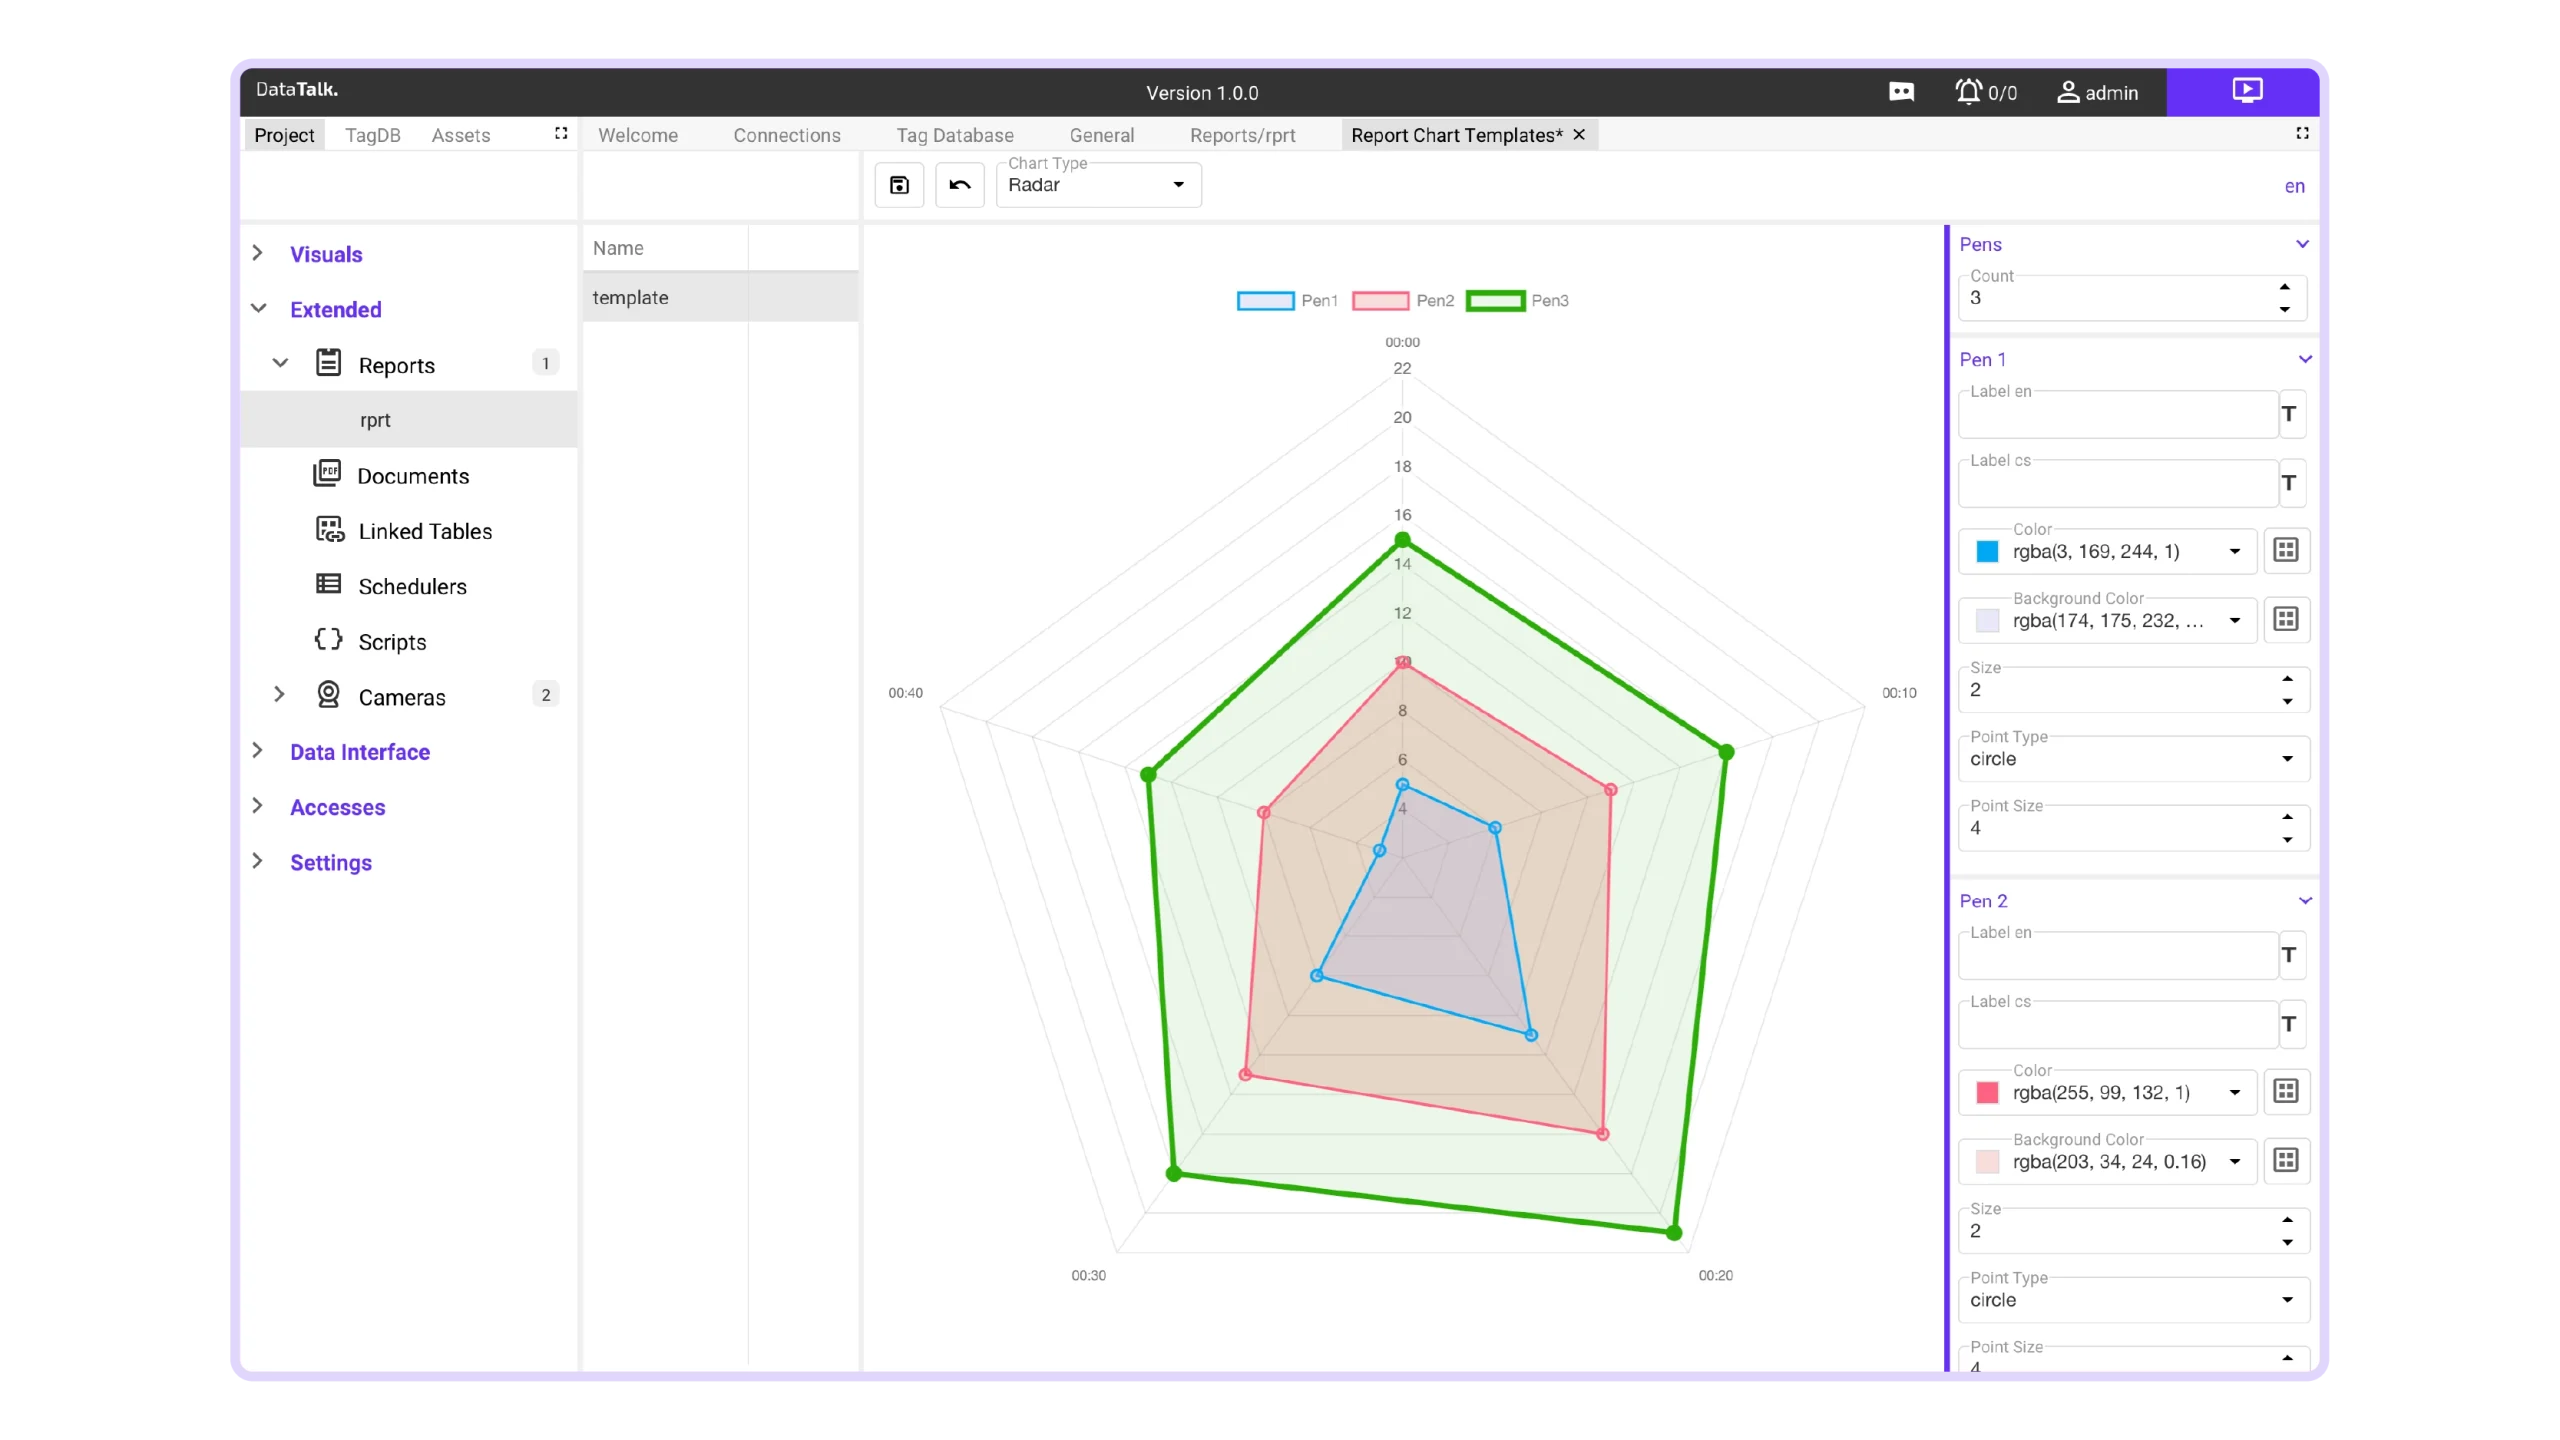
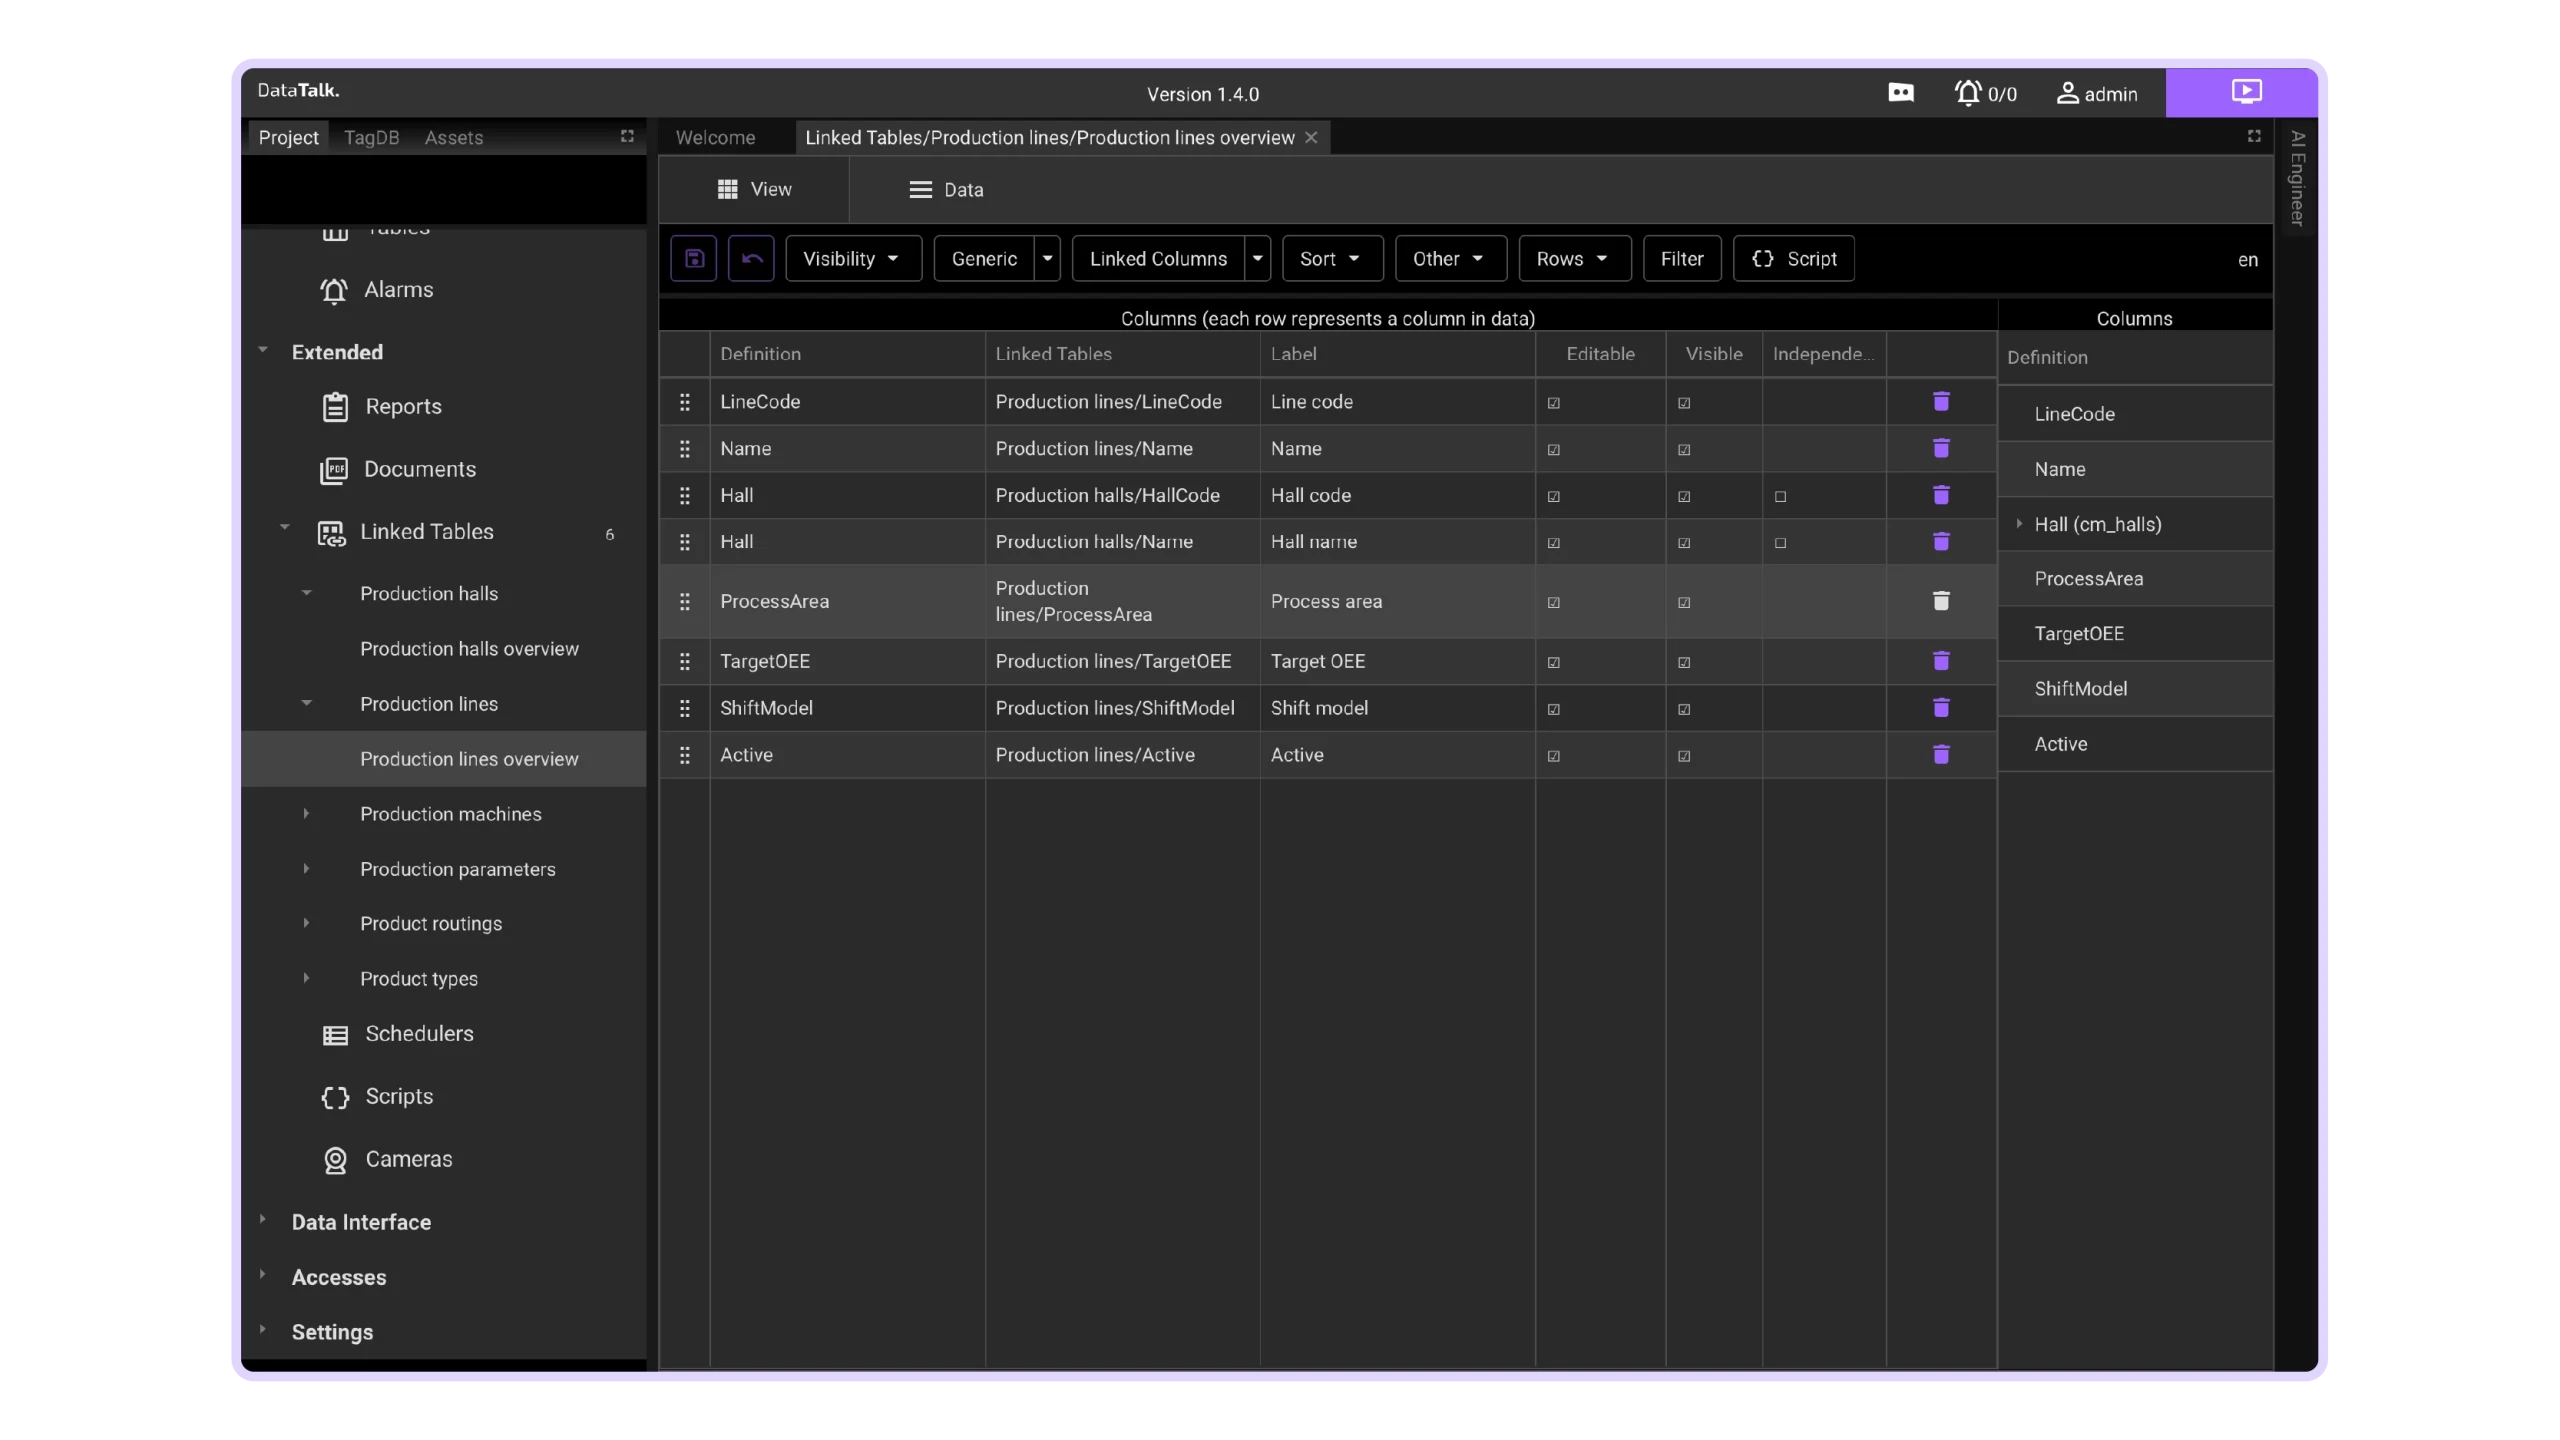
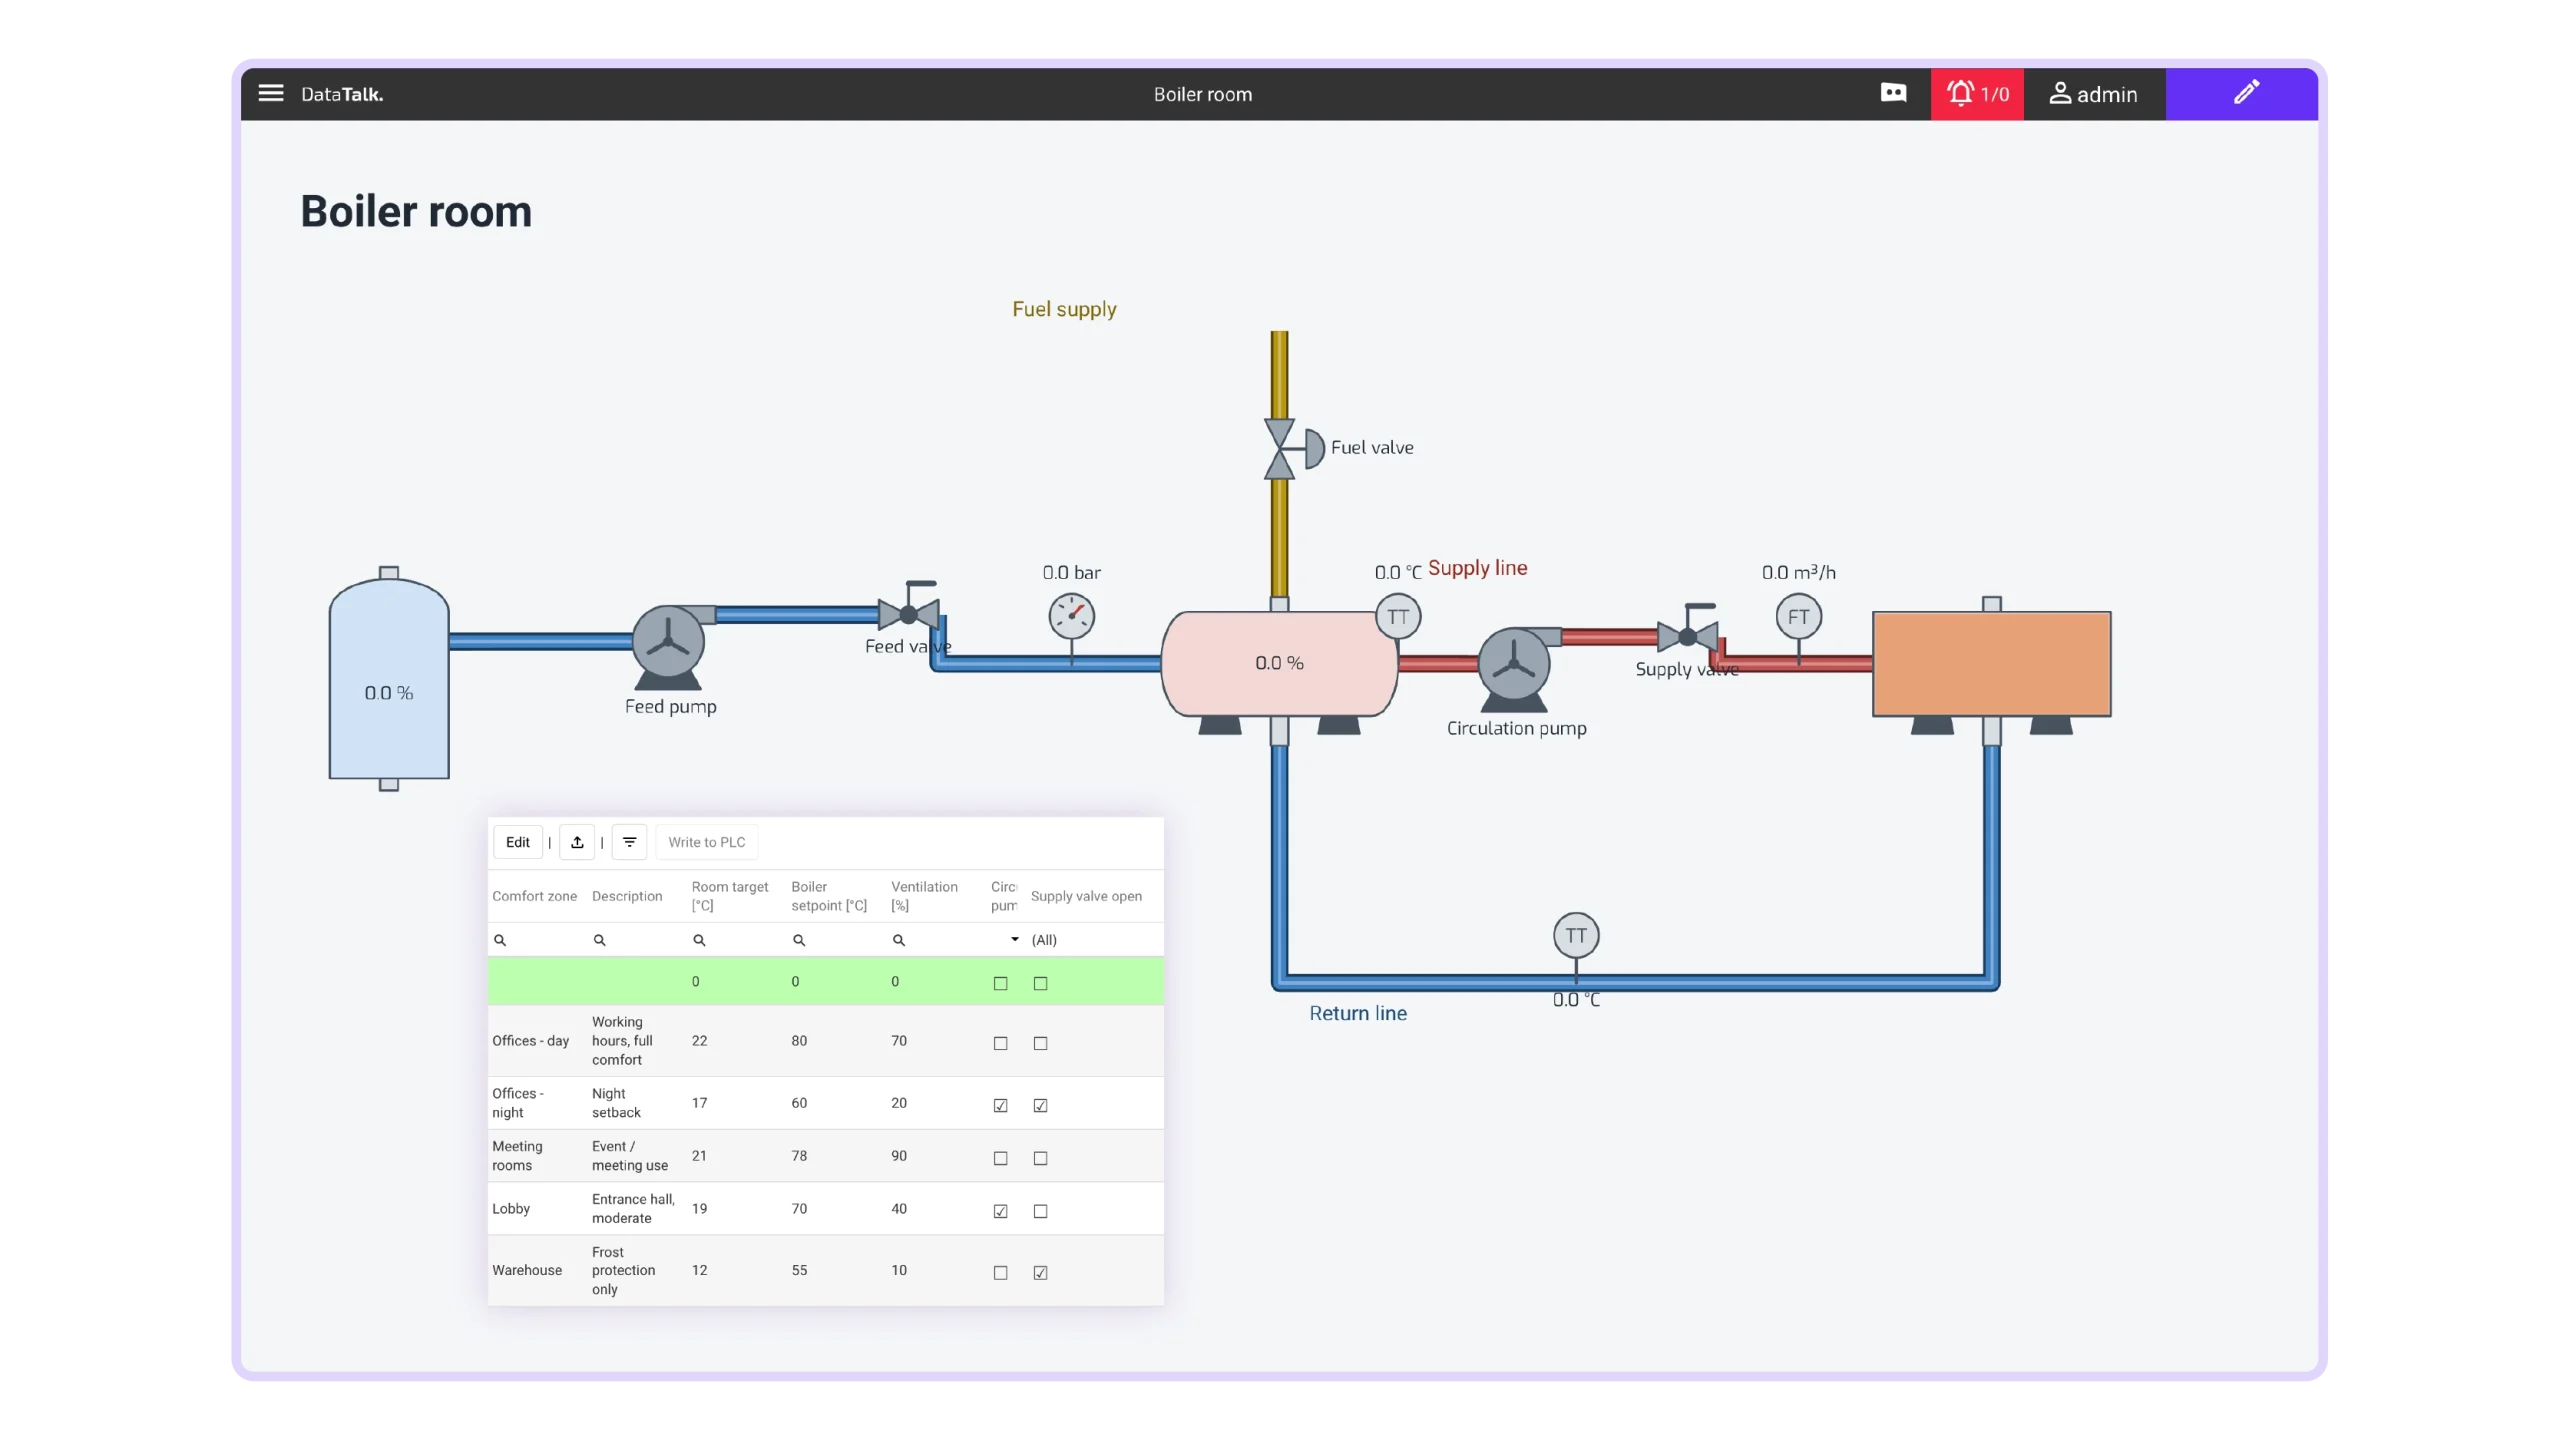
live design
Edit live. See it instantly.
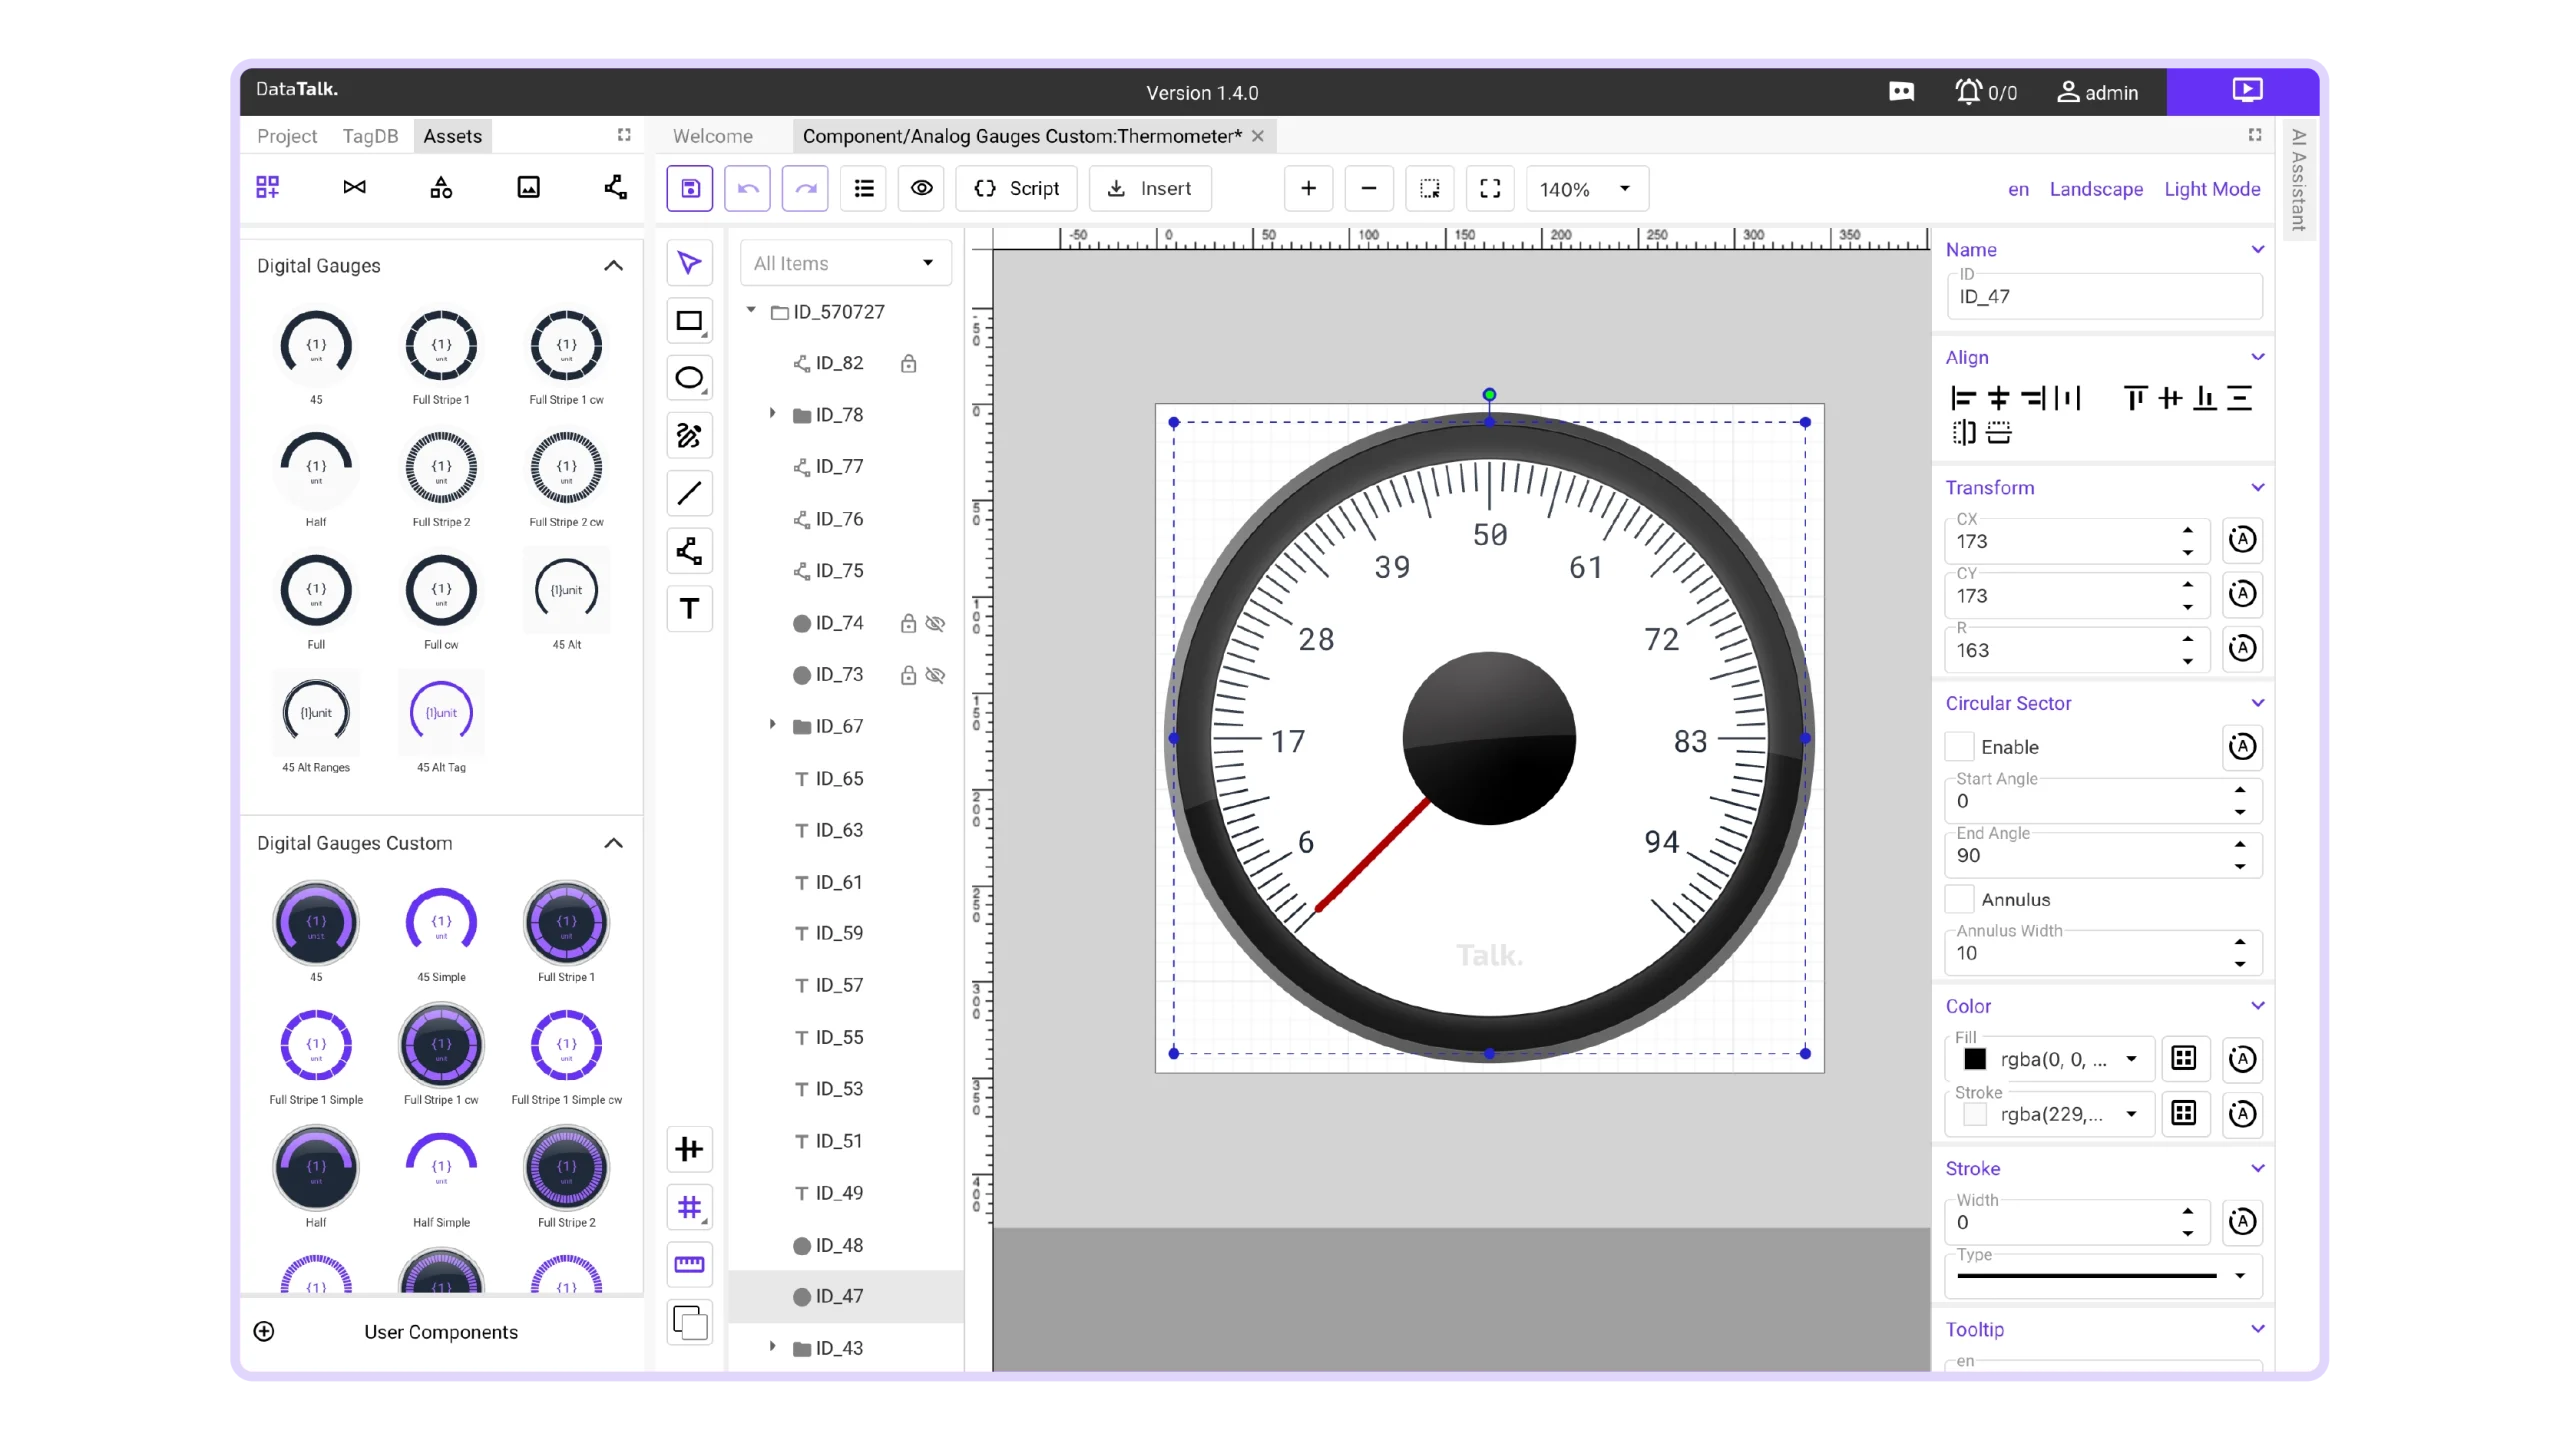
This isn’t a convenience feature. It’s a fundamentally faster development loop that compounds across every project you build — the more changes a project needs, the more time this saves you versus compiled HMI tools. Live design and drag and drop features make the project creation super easy.
Skip the Wait
See the results immediately. No compiling, no redeploying — just edit, test and keep moving.
Traditional HMI Software
DataTalk Web HMI
beyond the license
The Real Cost of HMI
In a typical HMI/SCADA project, software licensing may represent only a fraction of the total budget, while engineering, testing, commissioning and project changes account for much more.
That’s why DataTalk focuses on reducing the time it takes to build, test and update your HMI – not just the price of the software.
Where the cost goes
A €50,000 HMI project
- Same license price
- Faster engineering
- Lower total project cost

AI engineer
You Think. We build.
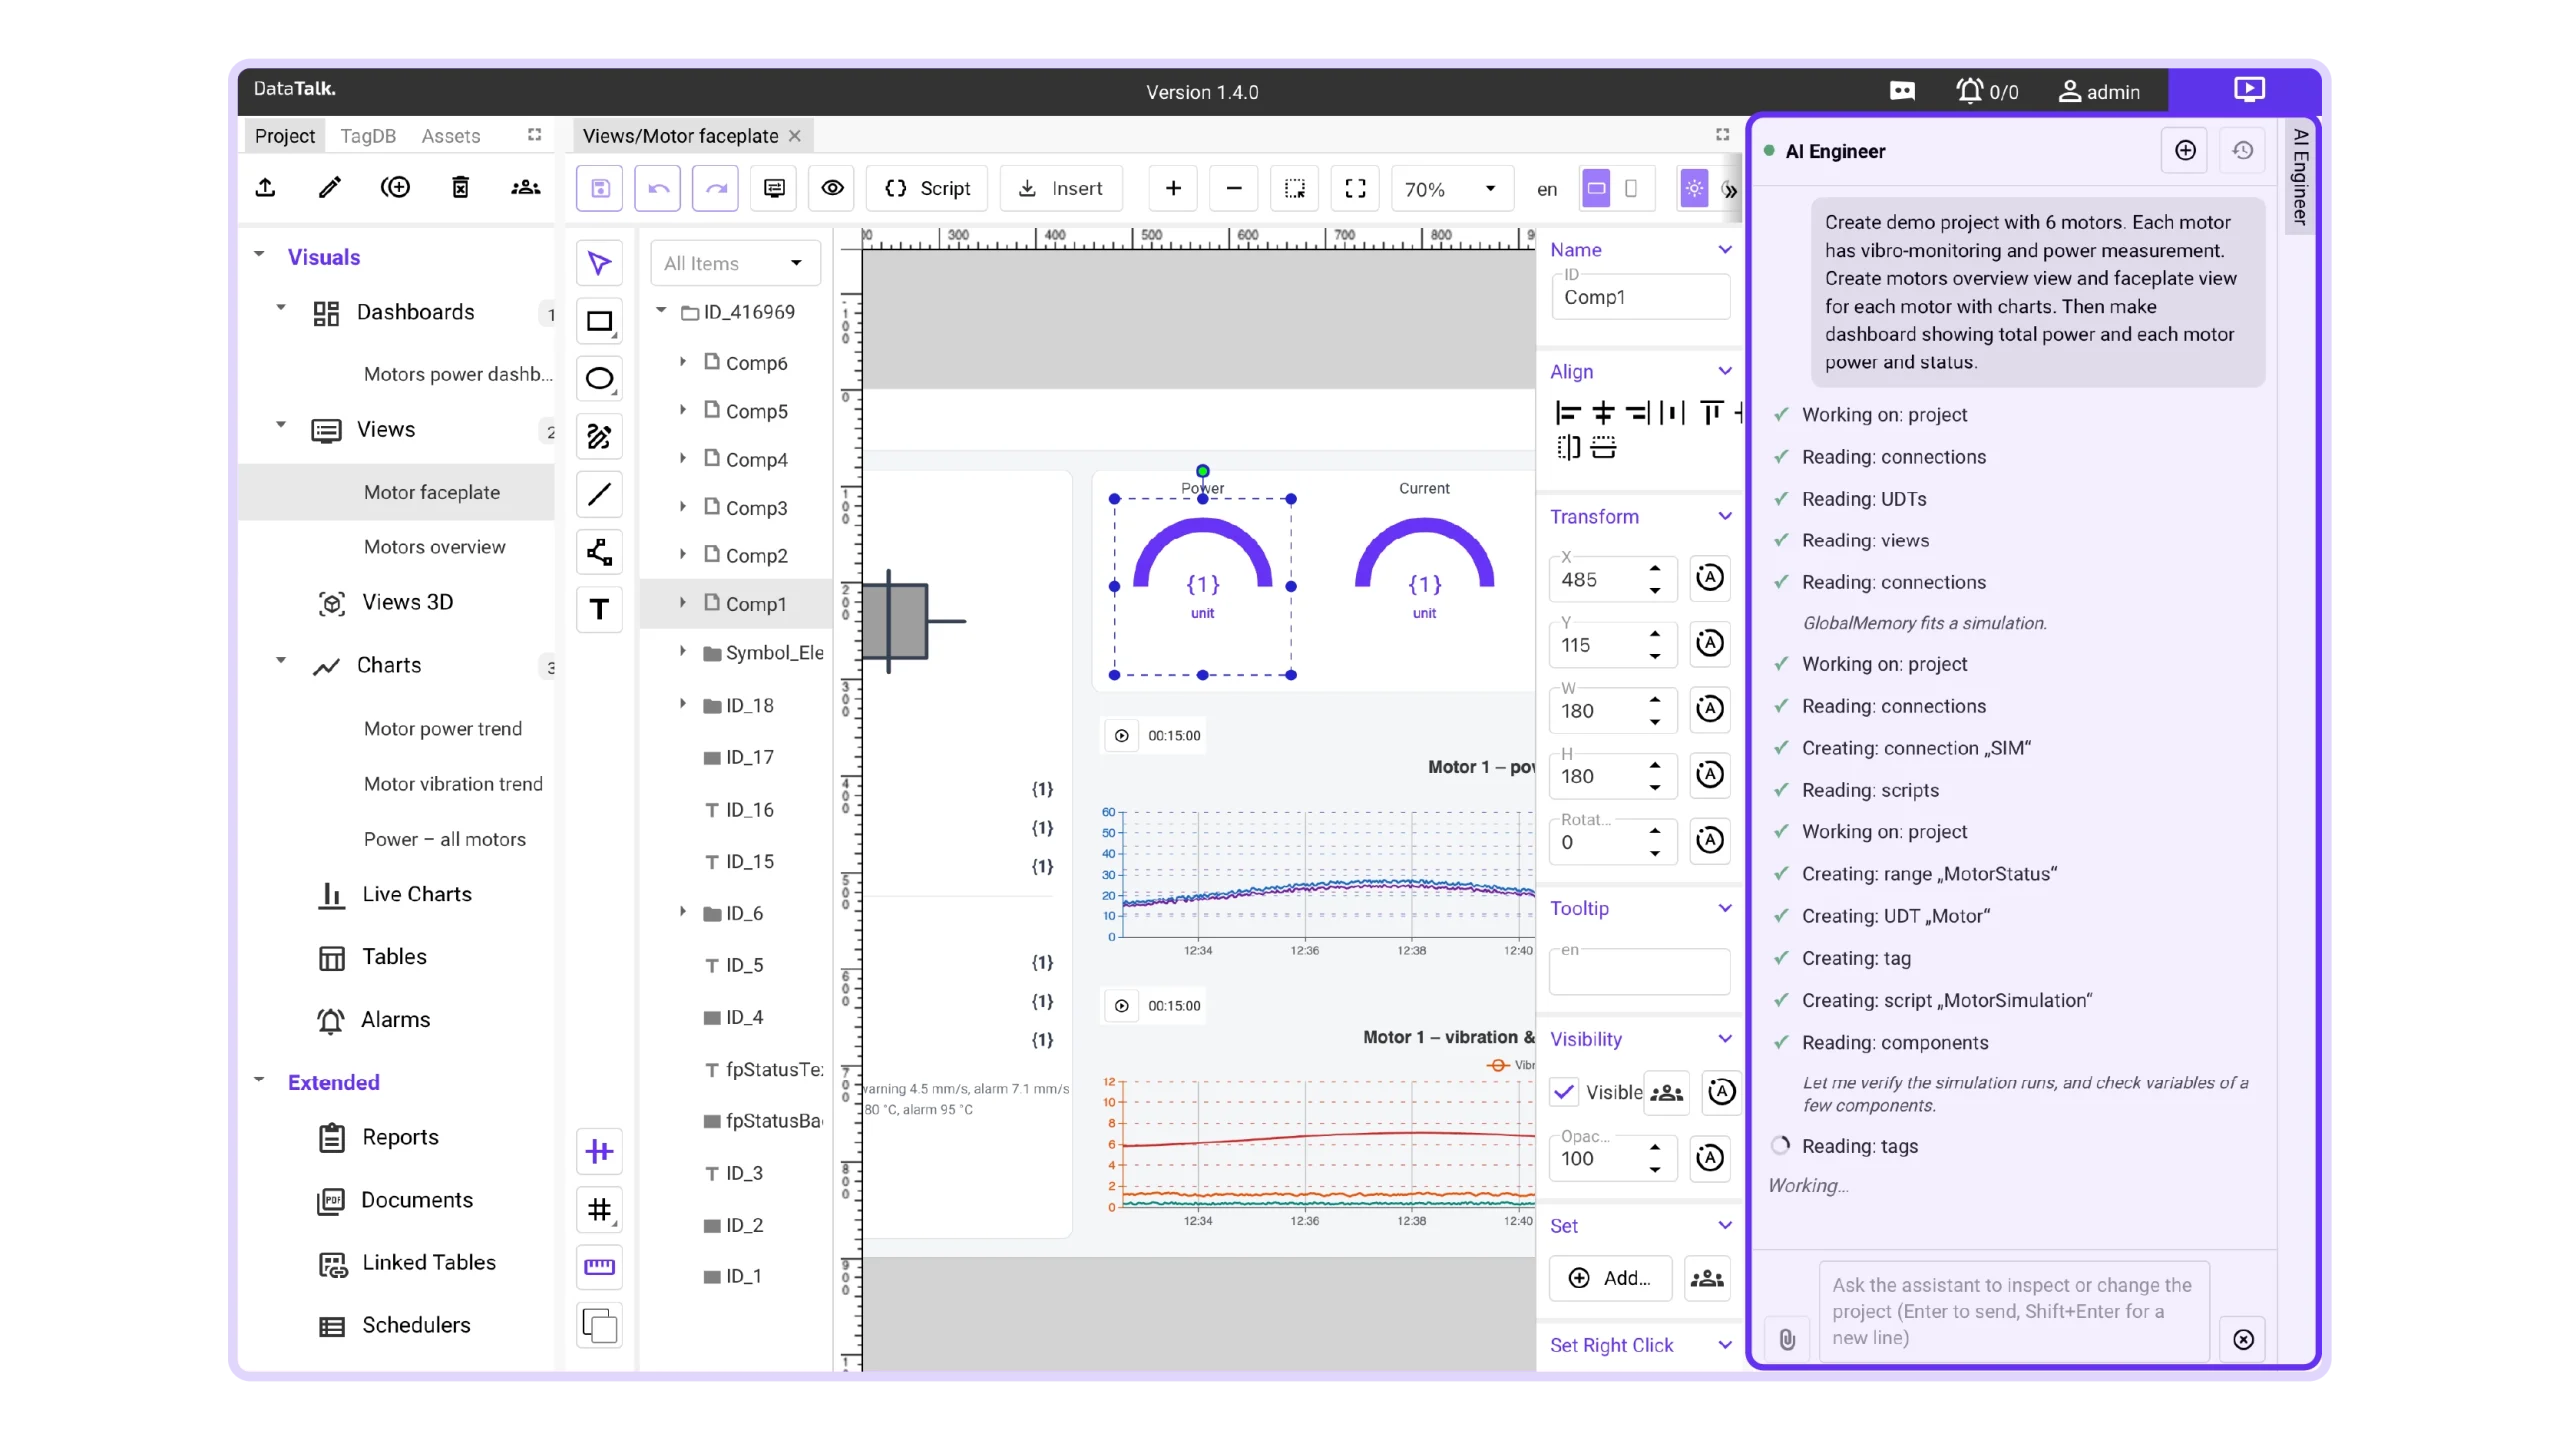
Most industrial “AI features” are just help chatbots. DataTalk’s AI Engineer works inside your project — creating screens, configuring objects, and modifying existing applications on command.
“You describe. AI engineers. You review and ship.”
Others give you templates. DataTalk gives you an AI assistant that does the work.
CREATE
Build your first project
From a quick demo to a full project
Describe what you want to monitor and control, and let AI Engineer create the screens and configure the components. Whether you’re trying out an idea or starting a full project, you can get going without learning every corner of DataTalk first.
FIX
Get things working again
Less searching, faster fixes
Something stopped working in an older project? Tell AI Engineer what’s wrong. It helps trace the issue through the project and fix it, saving you from checking every setting and connection by hand.
CHANGE
Make changes in one go
One request, across your project
“Raise the temperature limit to 85 °C for every oven on Line 2.” AI Engineer uses your project’s structure to find and update the relevant settings. No need to open each one individually.
LIVE
Bring your screens to life
You design. AI connects.
Already drawn your screens? Tell AI Engineer how they should work. It connects graphics to tags and sets up the behaviour and logic behind your buttons, indicators and other elements.
MIGRATE
Move your project to DataTalk
A head start on migration
You’ve already built your project once. Give AI Engineer the available files and information from your existing HMI or SCADA system, and let it help recreate the screens and functionality in DataTalk. How much it can recreate depends on the material you provide.
TRANSLATE
Let your project speak another language
AI-powered translations
Add a language and let AI translate your project’s text, alarms and other text elements. It uses context to keep translations clear and terminology consistent, saving you from editing each item by hand. A dedicated translation tool handles this separately, using fewer tokens than translating through a conversation with AI Engineer.
REFINE
Make your project look as good as it works
Better-looking projects, stronger first impressions
Turn a functional project into something you’re proud to present. Ask AI Engineer to refine layouts, harmonise colours and give your screens a consistent, professional look. Make your projects more appealing and help customers see the value of your solution – without spending hours on design.
Pricing
Licences
Our pricing is determined by the project size (tags), while everything else is unlimited. All product features are included. No hidden costs, just a clear, fair deal.
Our lifetime licensing ensures you maintain full ownership and control over your software.
Free
For testing and evaluation purposes only.
€ 0
Lifetime license
- Unlimited number of clients
- 50 Tags
- Support
S
For small and mid-sized projects.
€ 1000
Lifetime license
- Unlimited number of clients
- 500 Tags
- Support
M
For mid to large projects with no compromise.
€ 2 500
Lifetime license
- Unlimited number of clients
- 2 500 Tags
- Support
L
For large-scale projects that demand more.
€ 5 000
Lifetime license
- Unlimited number of clients
- 10 000 Tags
- Support
Enterprise
Unlock the unlimited world of experiences.
€
On request
Lifetime license
- Unlimited number of clients
- UNLIMITED Tags
- Support
Service & Support: The license is perpetual, with 5 years of free version upgrades and security updates included. A new major version is released annually, and your license remains eligible for free upgrades throughout the 5-year period; after that, a new license is required for further major-version upgrades.
Built-in Modules
Modules included in Web HMI product:
- DATA ACQUISITION & CONNECTIVITY
- TAG & DATA MANAGEMENT
- HISTORIAN & DATA STORAGE
- HMI & VISUALIZATION
- ALARMS & EVENTS
- REPORTING
- AUTOMATION & LOGIC
- ENGINEERING
- SECURITY & AUDIT
- AVAILABILITY & DEPLOYMENT
- AI
From connectivity and data storage to visualization and alarms — explore the modules included in your product. Download the complete feature overview for all the details.
FAQ
Common questions,
quick answers
Whether it’s a question, suggestion, or compliment, we’re here to listen. Reach out via contact form. We’ll get back to you promptly.
resources
Download section
Installation packages and more information about our products at a glance
Software:
Datasheet
Technical Specifications
| OPC UA | Siemens S7-1500 (Native OPC UA server), Beckhoff TwinCAT, B&R X20 & X90, Schneider Electric M580, Omron NX/NJ, Allen-Bradley, CompactLogix, ControlLogix |
|---|---|
| Modbus TCP/UDP | S7-1200 / 1500, Schneider Modicon, WAGO PFC200, Beckhoff, Omron CP, Allen-Bradley, MicroLogix, Unitronics Vision |
| Ethernet/IP | Allen-Bradley, Omron NX/NJ, Schneider M580, Beckhoff TwinCAT, WAGO |
| Ethernet/IP (Micro 800) | Allen-Bradley (Micro 800) |
| MQTT | WAGO PFC200, B&R X20 & X90, Schneider EcoStruxure PLC, Balluff IO-Link gateways, IFM |
| REST API | Beckhoff, WAGO PFC200, B&R Automation, Schneider EcoStruxure, any IT system supporting REST API interface |
| Databases | Microsoft SQL, MySQL, Oracle DB, PostgreSQL, MongoDB, MariaDB |
| Windows | Windows 11 – 23H2 and newer |
|---|---|
| Linux | Ubuntu 22.04 and newer, Debian 12 and newer, Raspbian 12 and newer |
| Docker | Any environment that supports Docker images (for example, Docker Desktop on macOS) |
| Free* | Lifetime licence, Unlimited number of clients, 50 tags, Community support |
|---|---|
| S | Lifetime licence, Unlimited number of clients, 500 tags, Limited support |
| M | Lifetime licence, Unlimited number of clients, 2 500 tags, Full support |
| L | Lifetime licence, Unlimited number of clients, 10 000 tags, Premium support |
| Enterprise | Lifetime licence, Unlimited number of clients, UNLIMITED tags, Premium+ support |
* For testing and evaluation purposes only.
| Processor | 4 Core CPU |
|---|---|
| Memory (RAM) | 8 GB |
| Storage | 128 GB SSD |
| Default Graphical Elements | Analog Gauges, Digital Gauges, Bars Vertical, Bars Horizontal, Buttons, Date & Time, Displays, Special, User Interface, … |
|---|---|
| Custom Graphical Elements | Create your own vector graphics and elements in our integrated visual editor. |
| P&ID Symbols | Centrifuges, Compressors, Crushers, Dryers, Filters, Instruments, Mixers, Motors, Peripherals, Pumps, Valves, Vessels, … |
| Icons & Material Symbols (Google) | Outlined, Rounded, Sharp |
| Bitmap Images | Upload your own images in .jpeg or .png format. |
| Industrial Automation & Process Monitoring | Real-time control and monitoring of industrial processes and equipment. |
|---|---|
| Smart Manufacturing & Industry 4.0 | Data-driven manufacturing with connected machines and intelligent systems. |
| Energy Management & Optimization | Monitoring and optimizing energy consumption and efficiency. |
| Smart Buildings & Infrastructure | Automated control and monitoring of building systems and infrastructure. |
| Logistics & Warehouse Management | Tracking and optimizing goods movement and warehouse operations. |
| Oil, Gas & Petrochemical Monitoring | Monitoring assets, processes, and safety in oil and gas operations. |
| Utilities & Smart Grids | Managing and optimizing electricity, water, and gas distribution networks. |
| Remote Asset & Equipment Monitoring | Monitoring asset health and performance from remote locations. |
| Healthcare & Medical Devices | Monitoring medical equipment and healthcare system data. |
| Fleet & Mobility Management | Tracking and optimizing vehicle fleets and mobility services. |
| Automotive & Connected Vehicles | Collecting and analyzing data from connected vehicles and systems. |
| Agriculture & Smart Farming | Data-driven monitoring and automation of agricultural operations. |
| Retail & Smart Point-of-Sale | Monitoring retail operations and intelligent point-of-sale systems. |
| Telecommunications & Network Monitoring | Monitoring network performance, availability, and traffic. |
| Public Safety & Emergency Services | Supporting real-time monitoring and coordination for emergency response. |
| Transportation & Smart Railways | Monitoring and optimizing transportation systems and railway operations. |
| Aerospace & Aviation Monitoring | Monitoring aircraft systems and aviation operations. |
| Mining & Heavy Industry | Monitoring equipment, safety, and processes in heavy industries. |
| Water & Wastewater Management | Monitoring and controlling water treatment and distribution systems. |
| Environmental Monitoring & Sustainability | Tracking environmental data to support sustainability goals. |
| Marine & Port Operations | Monitoring port infrastructure, vessels, and logistics operations. |
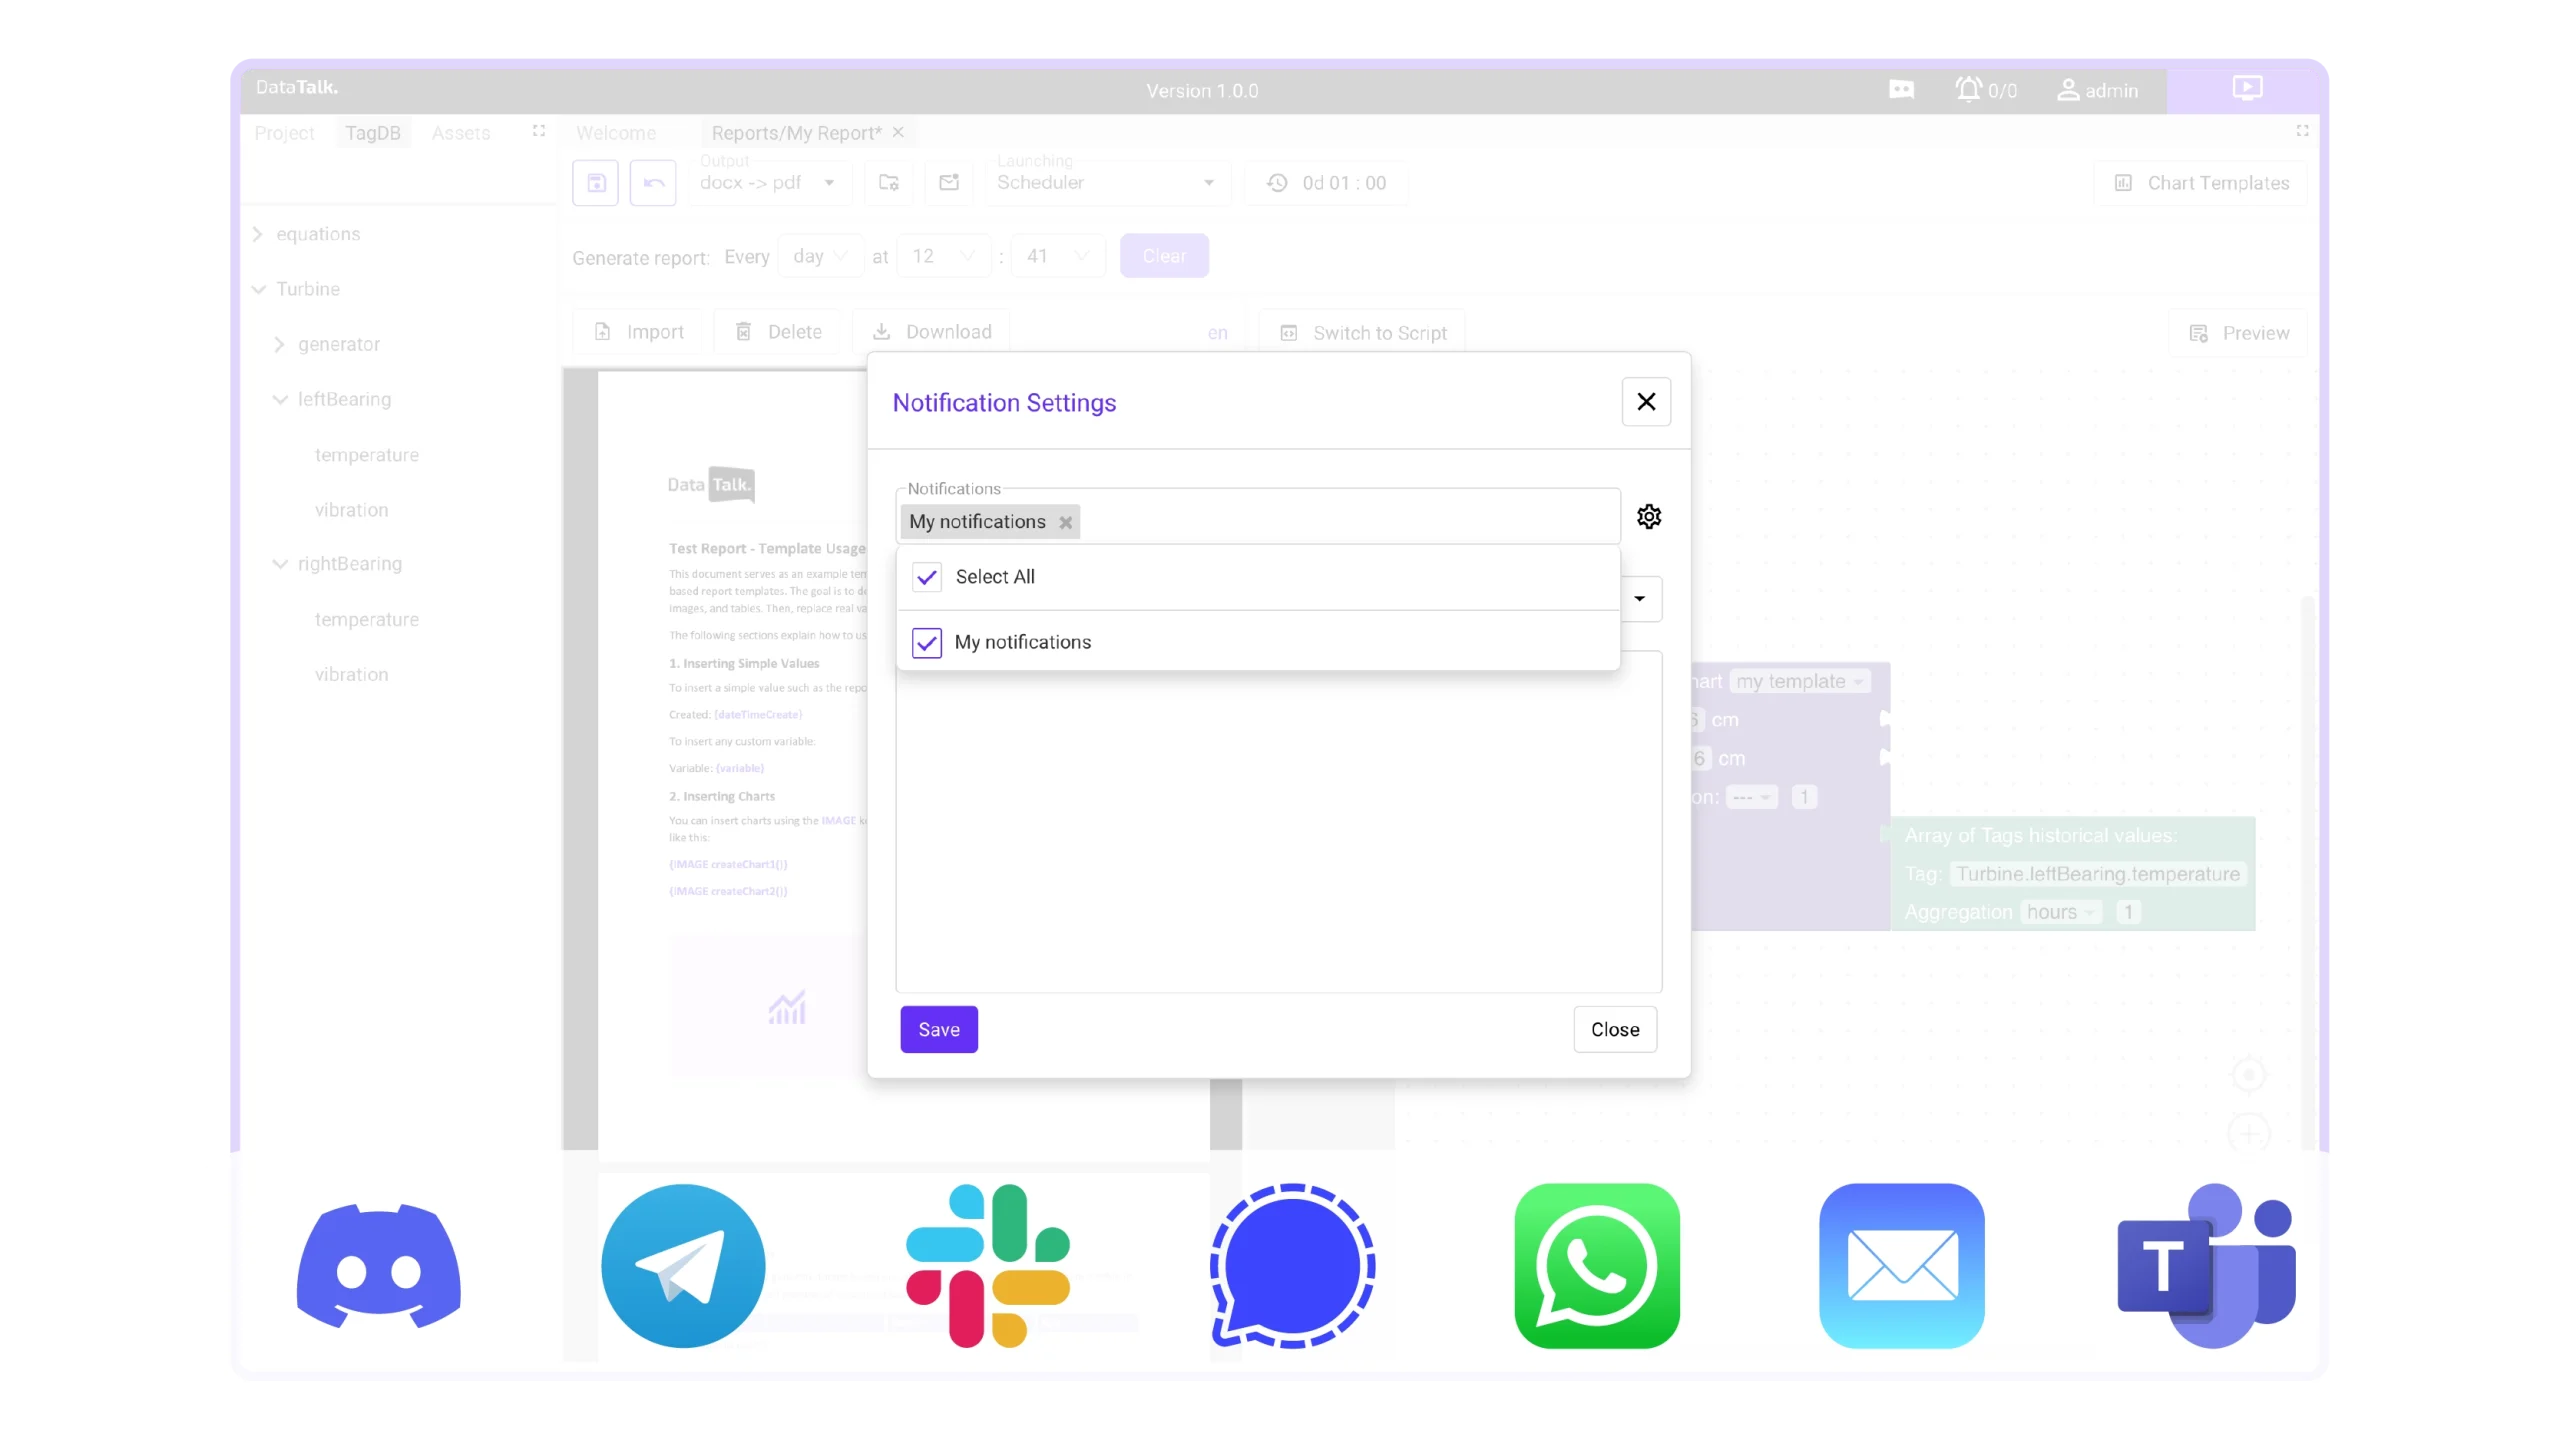
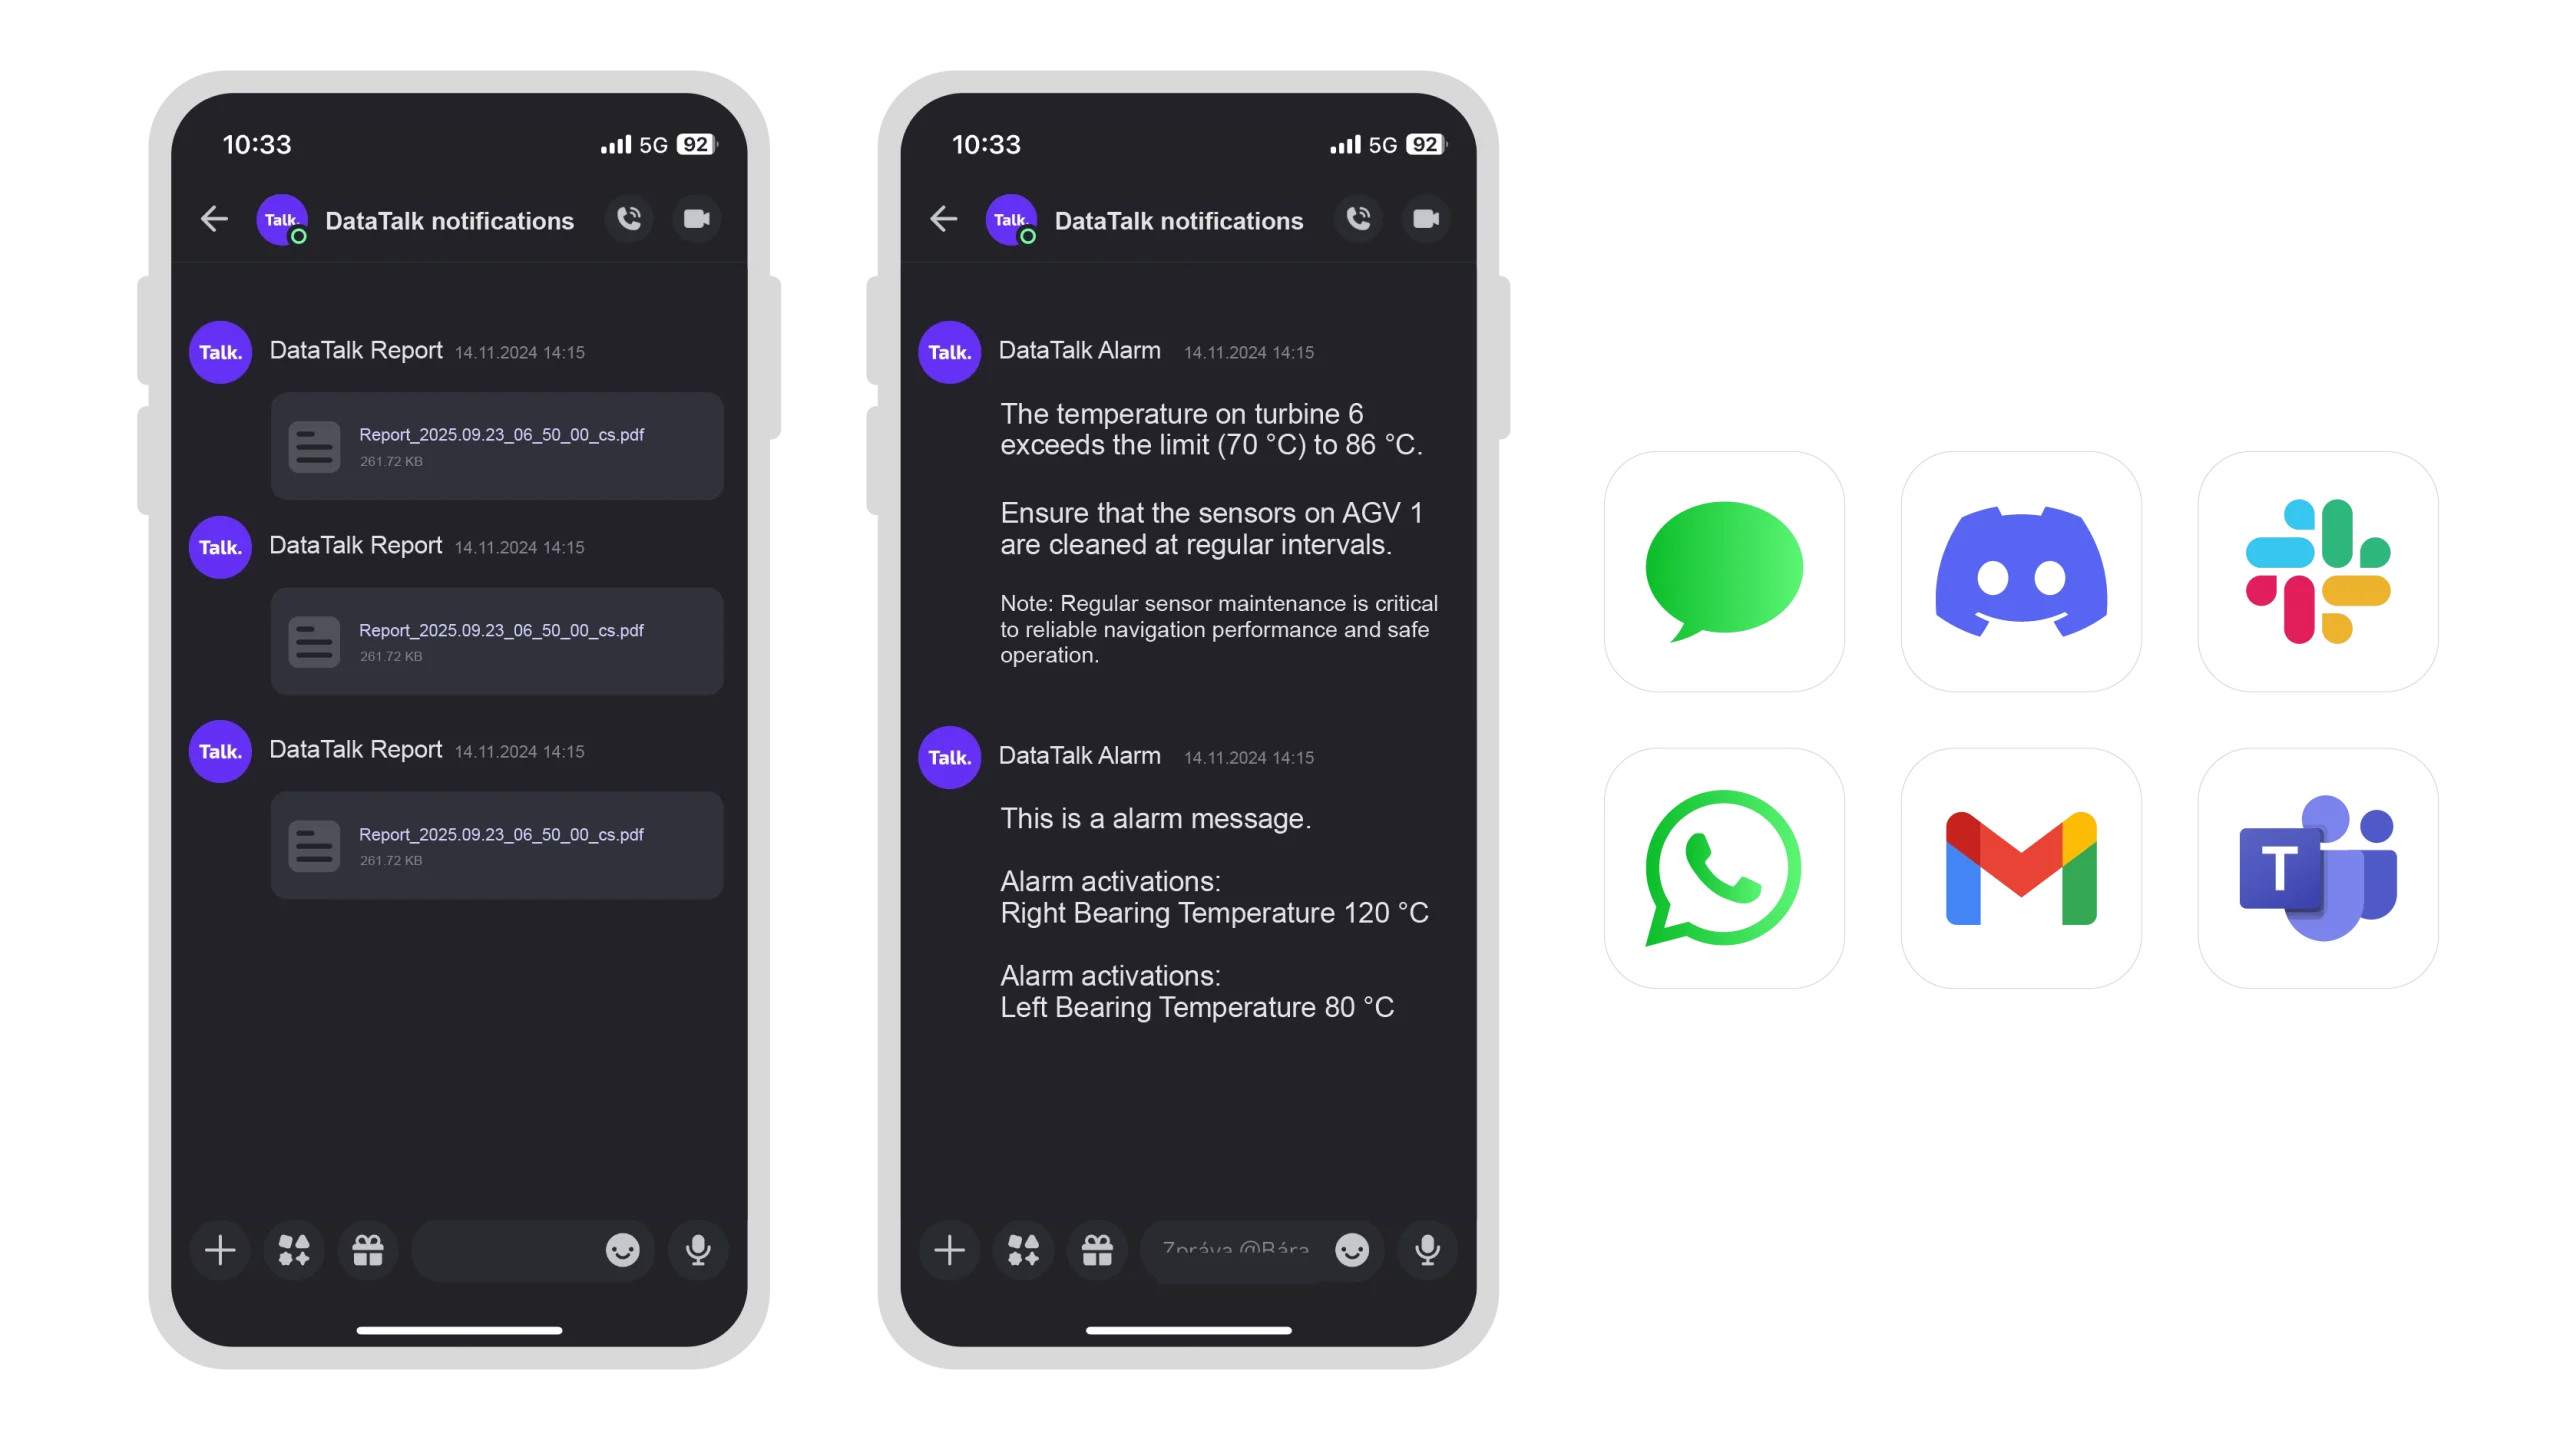
| Africa’s Talking, Apprise API, Automated Packet Reporting System (APRS), AWS SES, AWS SNS, Bark, Bluesky, BulkSMS, BulkVS, Burst SMS, Chanify, Clickatell, ClickSend, DAPNET, DingTalk, Discord, D7 Networks, E-Mail, Emby, Enigma2 Devices, FCM (Google Firebase Cloud Messaging), Feishu, Flock, Free-Mobile, Google Chat, Gotify, Growl, Guilded, Home Assistant, httpSMS, IFTTT, Jira, Join, Kavenegar, KODI, Kumulos, LaMetric Time/Clock, Line, Mastodon, Mailgun, Matrix, Mattermost, MessageBird, Microsoft Power Automate / Workflow (MS Teams), Microsoft Teams, Misskey, MQTT, MSG91, Nextcloud Messaging, Nextcloud Talk, Ntfy, Notica, Notifiarr, Notifico, Office 365, OneSignal, Opsgenie, PagerDuty, PagerTree, Parse Platform, Plivo, Popcorn Notify, Prowl, PushBullet, PushDeer, Pushed, Pushjet, PushMe, Pushover, PushSafer, Pushy, Reddit, Resend, Revolt, Rocket.Chat, RSyslog (Remote Syslog), Ryver, SendGrid, SendPulse, ServerChan, Seven, SFR, SimplePush, Sinch, SIGNL4, Signal (API), Slack, SMSEagle, SMS Manager, SMTP2Go, SparkPost, Splunk (VictorOps) On Call, Streamlabs, Synology, Syslog, Techulus Push, Telegram, Threema Gateway, Twilio, Twist, X (formerly known as Twitter), Voip.ms, Vonage, XBMC, Webex Teams, WeCom Bot, WhatsApp, WxPusher, Zulip |
Get in touch
Your feedback matters
Whether it’s a question, suggestion, or compliment, we’re here to listen. Reach out via contact form. We’ll get back to you promptly.
office
Czech Republic
Velvarská 1699/29
Prague
Czech Republic
office
Germany
Marktplatz 6
Thierstein
Germany
I have read and agree to the Privacy Policy.